Pulls back to the 21 EMA or 50 EMA?


0
0
  1. On an uptrend (>200 SMA), I’d like the signal to be that it pulls backs to 21 EMA or 50 EMA when it hooks up from 20. Is this the logic: SimpleMovingAve(“length” =200) is less than or equal to close and MovAvgExponential(“length”=21) is greater than or equal to close or MovAvgExponential(“length”=50) is greater than or equal to close?
  2. On a downtrend (<200 SMA), I’d like the signal to be that it pulls back to 21 EMA or 50 EMA when it hooks down from 80. Is this the logic for that: SimpleMovingAve(“length” =200) is greater than or equal to close and MovAvgExponential(“length”=21) is less than or equal to close or MovAvgExponential(“length”=50) is less than or equal to close?

What are the codes for those conditions and for scanning?

Please advise. Thanks!

Marked as spam
Posted by (Questions: 23, Answers: 57)
Asked on May 22, 2017 6:29 pm
848 views
0
Private answer

So you actually have a lot going on there. You have defined an uptrend and a downtrend. For each trend direction you have defined two separate patterns. Which involves the 21 and the 50 exponential moving averages. I see you also mention hooking up from 20 and hooking down from 80. I am guessing those are for the Stochastic although you don’t specifically mention that. I’ll consider your previous post in which we cover the Stochastic portion: https://www.hahn-tech.com/ans/alert-fullk-crosses-fulld-overbought/

So excluding the Stochastic I have the following code for you. I’ve broken down all the elements into separate lines so you can follow the logic. The last four lines are your signals. I did not provide any plots, leaving it to you to work out how you want to use the last four signals in whatever method you choose. I have not tested this so there may be some errors. Let me know how it works and I’ll make any adjustments needed to get things dialed in.

def ema1 = ExpAverage(close, 21);
def ema2 = ExpAverage(close, 50);
def sma1 = Average(close, 200);
def uptrend = close > sma1;
def downtrend = close < sma1; def pullBackEMA1 = close[1] > ema1[1] and close < ema1; def pullBackEMA2 = close[1] > ema2[1] and close < ema2;
def rallyToEMA1 = close[1] < ema1[1] and close > ema1;
def rallyToEMA2 = close[1] < ema2[1] and close > ema2;
def pullBack1 = uptrend and pullBackEMA1;
def pullBack2 = uptrend and pullBackEMA2;
def rallyBack1 = downtrend and rallyToEMA1;
def rallyBack2 = downtrend and rallyToEMA2;

Marked as spam
Posted by (Questions: 37, Answers: 4086)
Answered on May 22, 2017 6:50 pm
0
Private answer

Hi Pete,

When I do this to the last 4 lines:

Plot pullBack1 = uptrend and pullBackEMA1;
Plot pullBack2 = uptrend and pullBackEMA2;
#Plot rallyBack1 = downtrend and rallyToEMA1;
#Plot rallyBack2 = downtrend and rallyToEMA2;

Why does it give an error: “Exactly one plot expected”?

Marked as spam
Posted by (Questions: 23, Answers: 57)
Answered on May 22, 2017 7:40 pm
0
I was doing that code in the Scan. Also, I want to add the code when price pulls back to the SMA 200 and rallies to SMA200, would that code be like this: def pullBackSMA1 = close[1] > sma1[1] and close < sma1; def rallyToSMA1 = close[1] sma1; def pullBack3 = uptrend and pullBackSMA1; def rallyBack3 = downtrend and rallyToSMA1; My purpose to do all this is to put in the Scan and let it scans for those signals.
( at May 23, 2017 4:50 am)
0

The last four lines are your signals. You don’t turn them into plots. The scan only accepts one plot. You can add any number of your signals to the scan like this:

plot scan = pullBack1 or pullBack2 or rallyBack1 or rallyBack2;

Your code to measure pullbacks to the 200 sma cannot include uptrend. Because the uptrend contradicts the rule of the pullback to the 200 sma and the downtrend contradicts the rule for the rallyback to 200 sma.

( at May 23, 2017 7:53 am)
0
Private answer

Hi Pete,

I used the “Plot scan” above and it gave attached error (it did not allow me to copy the error in Scan). Please see attached file.

Thanks.

Attachments:
Marked as spam
Posted by (Questions: 23, Answers: 57)
Answered on May 23, 2017 11:04 am
0
In the same code, I have this line included above that plot scan for the hooks of Stoch that we worked in other post: Plot signal = fullKCrossesFromOverbought and fullKCrossesAboveFullD; That error might have something to do with this?
( at May 23, 2017 11:09 am)
0

Try reducing it down to one or two conditions and see if that works.

( at May 23, 2017 12:26 pm)
0
Plot signal = fullKCrossesFromOverbought and fullKCrossesBelowFullD; plot scan = pullBack1 or pullBack2 or rallyBack1 or rallyBack2; I am not sure how to reduce or combine these two lines, because Scan does not allow. It still gives same error and \”exactly one plot expected\”. Please show how. Thanks!
( at May 23, 2017 12:41 pm)
0

I tried the code this way, and it did not give error. Please look over it to see if the logic correct:
plot scan = (pullBack1 or pullBack2 or rallyBack1 or rallyBack2) and (fullKCrossesFromOverbought and fullKCrossesBelowFullD);
Alert(scan, ”FullK and FullD Crossing: Overbought”, Alert.BAR, Sound.RING);
Thanks!

( at May 23, 2017 12:59 pm)
0
Private answer

I don’t think the logic is working. Please see attached file. Though price gets near EMAs, it’s not hooking up from 20, but it already gives scan result. Please check. Thanks.

Attachments:
Marked as spam
Posted by (Questions: 23, Answers: 57)
Answered on May 23, 2017 1:04 pm
0
Private answer

Please see attached screen shot. Scan gives this as a Sell signal. However, price is above EMAs and not even pulls back and it hooks down from 80. Price supposed to rally up if it’s a sell hooking down. Logic is not working somehow.

Please show how to fix. Thanks

Attachments:
Marked as spam
Posted by (Questions: 23, Answers: 57)
Answered on May 23, 2017 1:30 pm
0
Private answer

Please see attached file. Scan gives as a Buy. Though hooks up from 20, price not even pullback near EMAs yet. It gives signal too soon.

Thanks.

Attachments:
Marked as spam
Posted by (Questions: 23, Answers: 57)
Answered on May 23, 2017 1:34 pm
0
Private answer

See attached file. Scan gives as a Sell. However, price still above EMAs (even above 200). Logic is not working.

Thanks.

Attachments:
Marked as spam
Posted by (Questions: 23, Answers: 57)
Answered on May 23, 2017 1:38 pm
0
Private answer

Please see attached file. Scan gives signal as a buy. However, price still above EMAs, even though it’s hooking down from 80.

Attachments:
Marked as spam
Posted by (Questions: 23, Answers: 57)
Answered on May 23, 2017 2:00 pm
0

I meant for picture above, price below EMAs but Scan gives it as a BUY signal even though it’s hooking down from 80.

( at May 23, 2017 2:02 pm)
0
Private answer

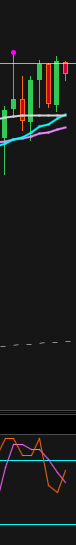
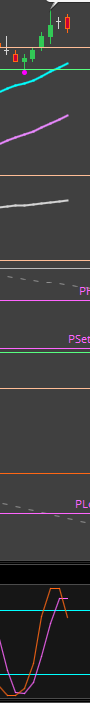
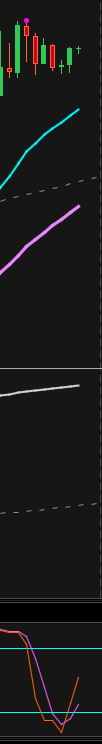
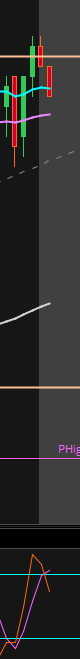
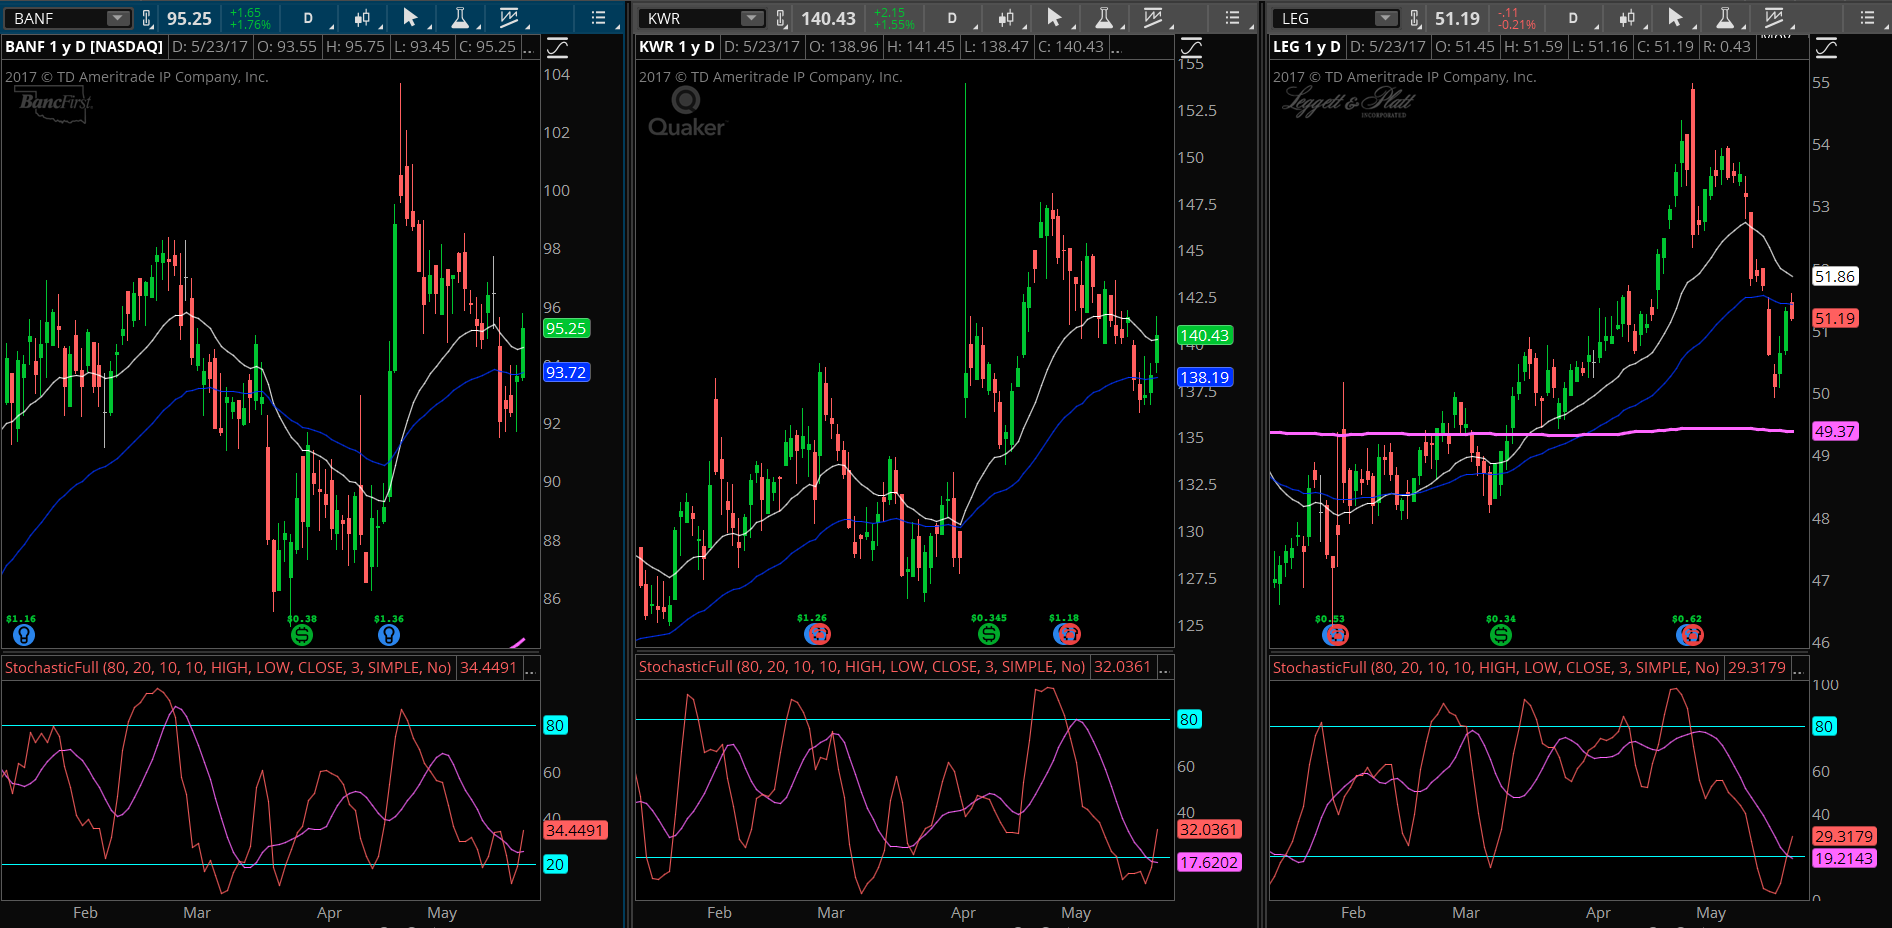
Ok, I regret that this post has dragged on for so long without coming to a conclusion. I had expected that the code I had provided was clear and concise enough that it could be easily understood and flexible enough for viewers to apply as they saw fit. I was incorrect, and I apologize. So here is the code and associated screenshot. This code combines the Stochastic “hooks” as well as the price pullbacks and rallies to the key moving averages of 21 EMA and 50 EMA. The 200 SMA is used as the trend direction. This code includes the elements from the Stochastic and everything is combined into a single cohesive program. There are two modes for this scan. One finds potential long signals while the other finds potential short signals. You cannot run them both together. The signals you are searching for almost never occurr at the same time. So the pullback to the EMA has to occur first, followed by the Stochastic “hook”. To accomplish this I have included 5 bars of space for both conditions to have occurred. The screenshot shows three charts, each were picked up in a current scan using daily time frame. In each chart you can see the pullback to a key EMA has occurred several bars prior to the Stochastic “hook”. Having provided this solution I am closing this topic so as to avoid any further confusion for future visitors to this post.


input over_bought = 80;
input over_sold = 20;
input KPeriod = 10;
input DPeriod = 10;
input priceH = high;
input priceL = low;
input priceC = close;
input slowing_period = 3;
input averageType = AverageType.SIMPLE;
def lowest_k = Lowest(priceL, KPeriod);
def c1 = priceC - lowest_k;
def c2 = Highest(priceH, KPeriod) - lowest_k;
def FastK = if c2 != 0 then c1 / c2 * 100 else 0;
def FullK = MovingAverage(averageType, FastK, slowing_period);
def FullD = MovingAverage(averageType, FullK, DPeriod);
def fullKCrossesFromOverbought = FullK[1] > 80 and FullK < 80; def fullKCrossesBelowFullD = FullK[1] > FullD[1] and FullK < FullD;
def stochasticSell = fullKCrossesFromOverbought and fullKCrossesBelowFullD;
def fullKCrossesFromOversold = FullK[1] < 20 and FullK > 20;
def fullKCrossesAboveFullD = FullK[1] < FullD[1] and FullK > FullD;
def stochasticBuy = fullKCrossesFromOversold and fullKCrossesAboveFullD;
def ema1 = ExpAverage(close, 21);
def ema2 = ExpAverage(close, 50);
def sma1 = Average(close, 200);
def uptrend = close > sma1;
def downtrend = close < sma1; def pullBackEMA1 = close[1] > ema1[1] and close < ema1; def pullBackEMA2 = close[1] > ema2[1] and close < ema2;
def rallyToEMA1 = close[1] < ema1[1] and close > ema1;
def rallyToEMA2 = close[1] < ema2[1] and close > ema2;
def pullBack1 = uptrend and pullBackEMA1;
def pullBack2 = uptrend and pullBackEMA2;
def rallyBack1 = downtrend and rallyToEMA1;
def rallyBack2 = downtrend and rallyToEMA2;
# use this scan to seach for long entry signals
plot scan = stochasticBuy and (pullBack1 or pullBack2) within 5 bars;
# use this scan to search for short entry signals
#plot scan = stochasticSell and (rallyBack1 or rallyBack2) within 5 bars;

Attachments:
Marked as spam
Posted by (Questions: 37, Answers: 4086)
Answered on May 23, 2017 3:41 pm
0

Pete,
Thank you very much for your generosity and professionalism! Your work is highly appreciated.

( at May 23, 2017 6:34 pm)