| ♥ 0 |
Pete, My hope is that the column box will turn green when the scan indicates that a crossover is occurring in the selected plot for your Relative Strength Scan study. For example my code below is selected for the bullish crossover and this is what I would like indicated in green in the column. Although I do have the dates matched for my chart and the code below and the date selected is a Friday the watchlist column is giving no indication using this code. Ideally the look back period could be 3 days while also responding to crossovers that are occurring in current trading day. declare lower; def RS = if close2 == 0 then 0 else close/close2; def startDate = DaysFromDate(referenceDate) == 0; addchartbubble(startDate, RS, “Start”, color.RED); def sr = CompoundValue(“historical data” = RS[0], “visible data” = if startDate <= 0 then sr[1] else RS[0]); # use this plot statement to find bullish crossovers # use this plot statement to find bearish crossovers # use this plot statement to find stocks trending stronger than the index # use this plot statement to find stocks trending weaker than the index
Marked as spam
Asked on October 8, 2018 10:19 am
337 views
|
|
Private answer
I updated the title of your question to distinguish it from your previous post: https://www.hahn-tech.com/ans/watchlist-column-available-for-relative-strength-scan/ So glad you included your code as well as a clear description of what you are trying to achieve. First item to mention is that we want to remove the AddChartBubble() statement. This may or may not cause the code to fail. Better safe than sorry. Aside from that, I really don’t see any attempts to modify the code as you specified. This looks just like the code I presented in the video. Not sure that was your intention. As such, I really don’t have anything to explain about your attempt. So I will just provide the working code here:
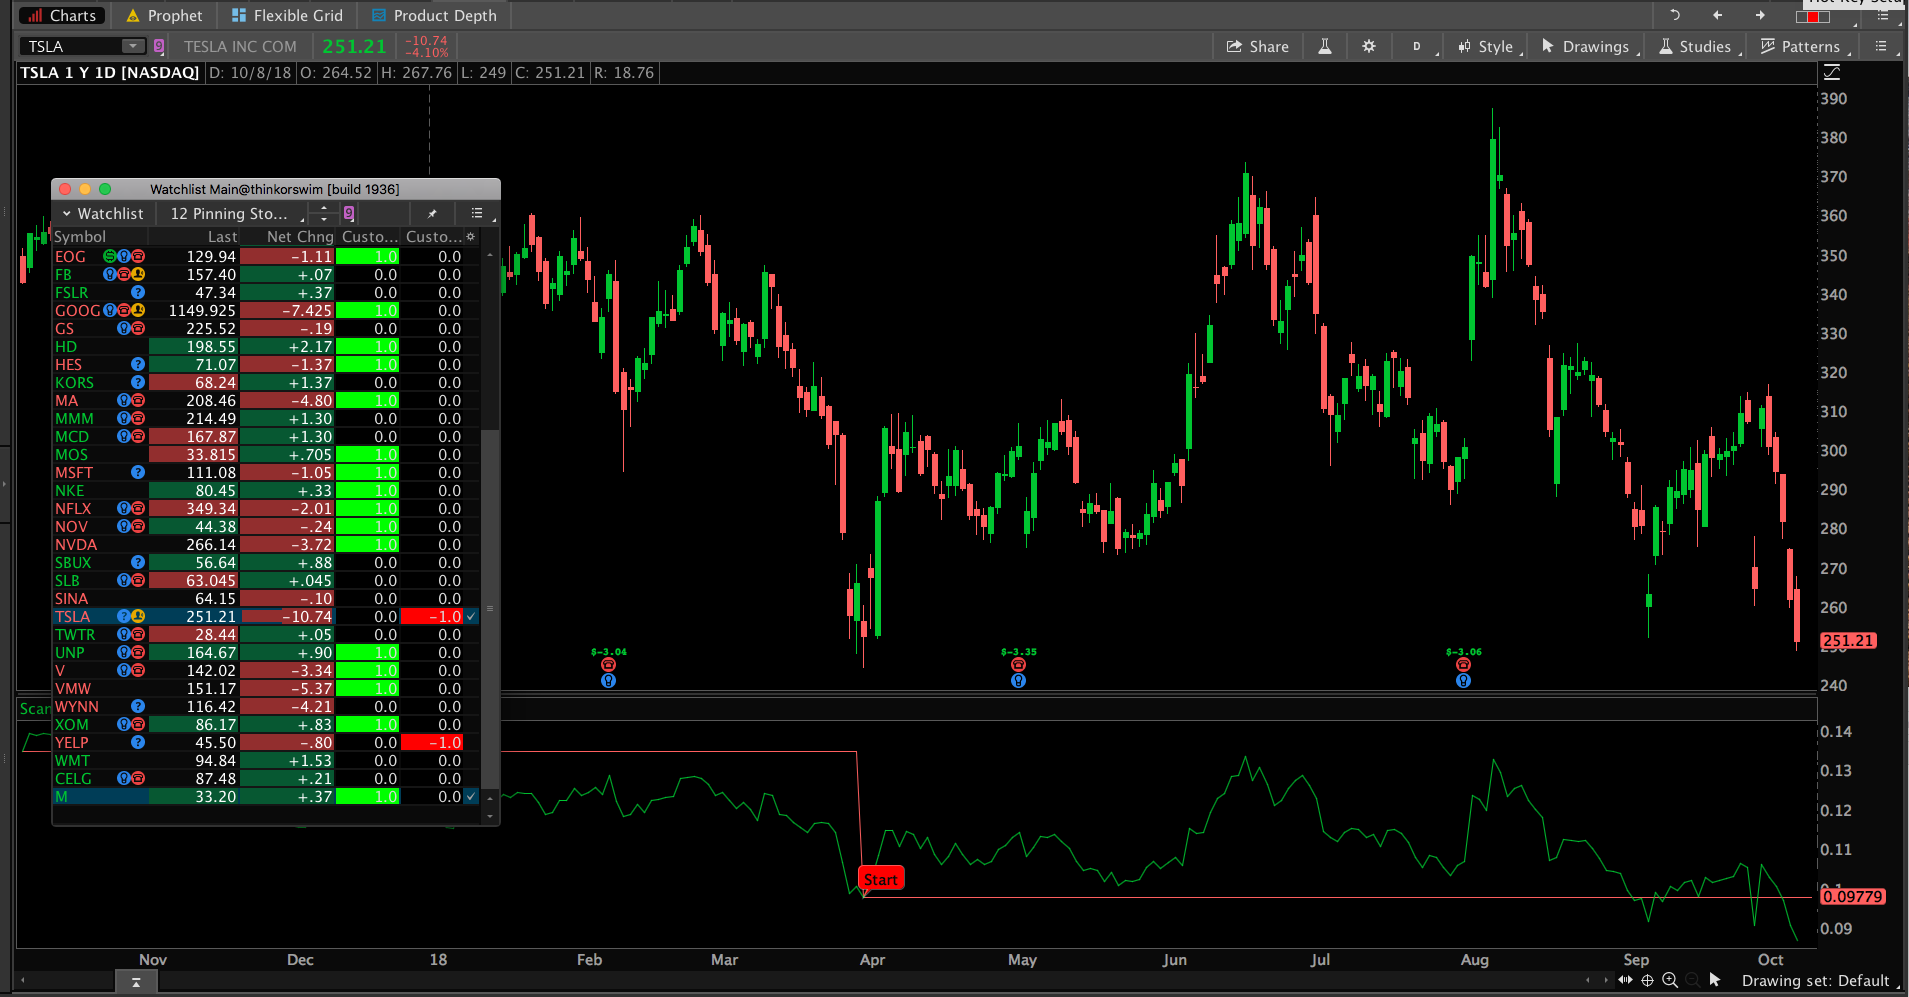
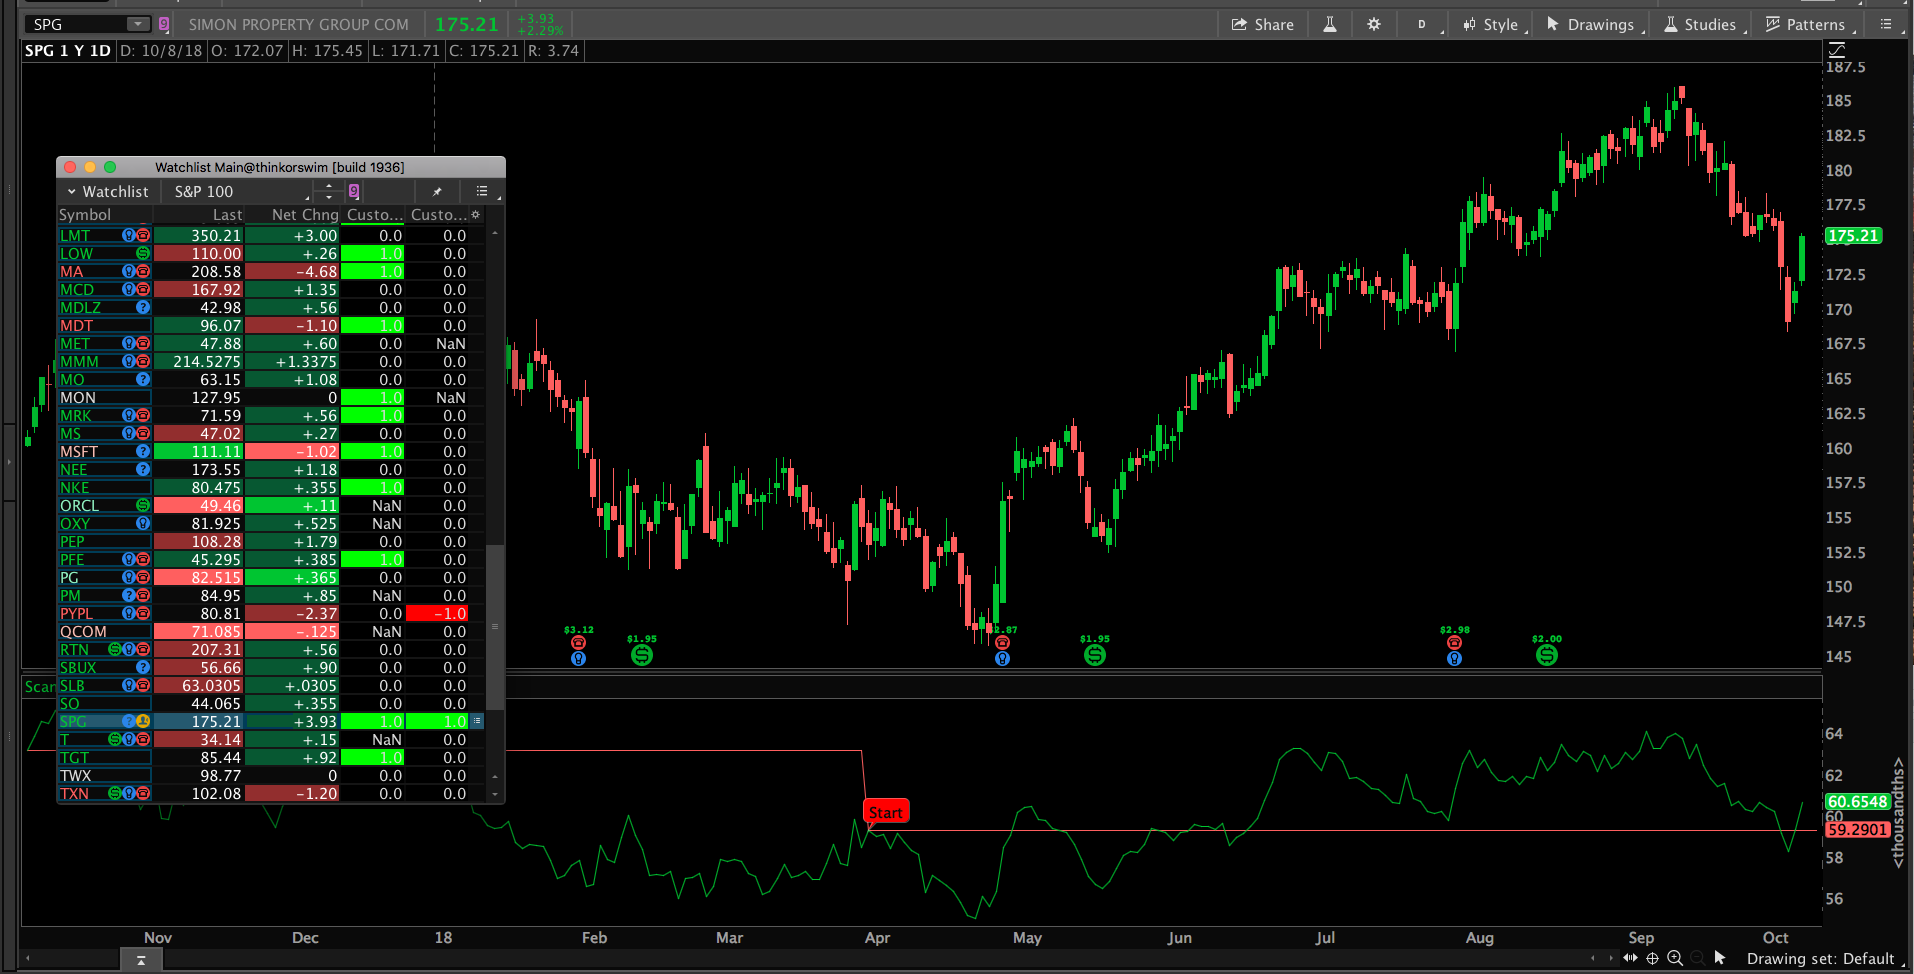
Screenshots below shows the results. Please note, I have set the “referenceDate” input to about 6 months prior. Not sure what you had in mind by setting the date to three days ago. I understand you wanted the code to find crossovers having occurred on any of the most recent 3 bars (look back period). But setting that date to three days ago does not achieve that. What does achieve that are these two lines:
Change the value of 3 to however many days you want to look back for crossovers. I will add that the reference date must be set to more days ago then whatever value you apply to the look back period. Attachments:
Marked as spam
Answered on October 8, 2018 12:59 pm
|
Sorry for posting as an answer before. Here it is again in comments. Sorry for the inconvenience! ?
The results I am getting are Nans with a couple of zeros. Perhaps this result is due to markets being closed?
Check it in the morning after markets open. If using SPX as the comparison ticker, SPX must be trading in order for this to work. You may also try using Thinkorswim’s OnDemand feature to replay markets from a previous day.
Yes Pete both columns seem to be working fine when market is open. Its very cool to be able to view at a glance which stocks are just crossing into higher relative strength territory and also ones that are trading there already. Of course many of the signals will be stocks bouncing along the line but I wouldn’t want to filter these as there are other factors to consider whether a trade may be possible or not. thanks again Pete!