| ♥ 0 |
A couple questions regarding RSI.
Attachments:
Marked as spam
Asked on January 6, 2018 12:06 pm
1021 views
|
|
Private answer
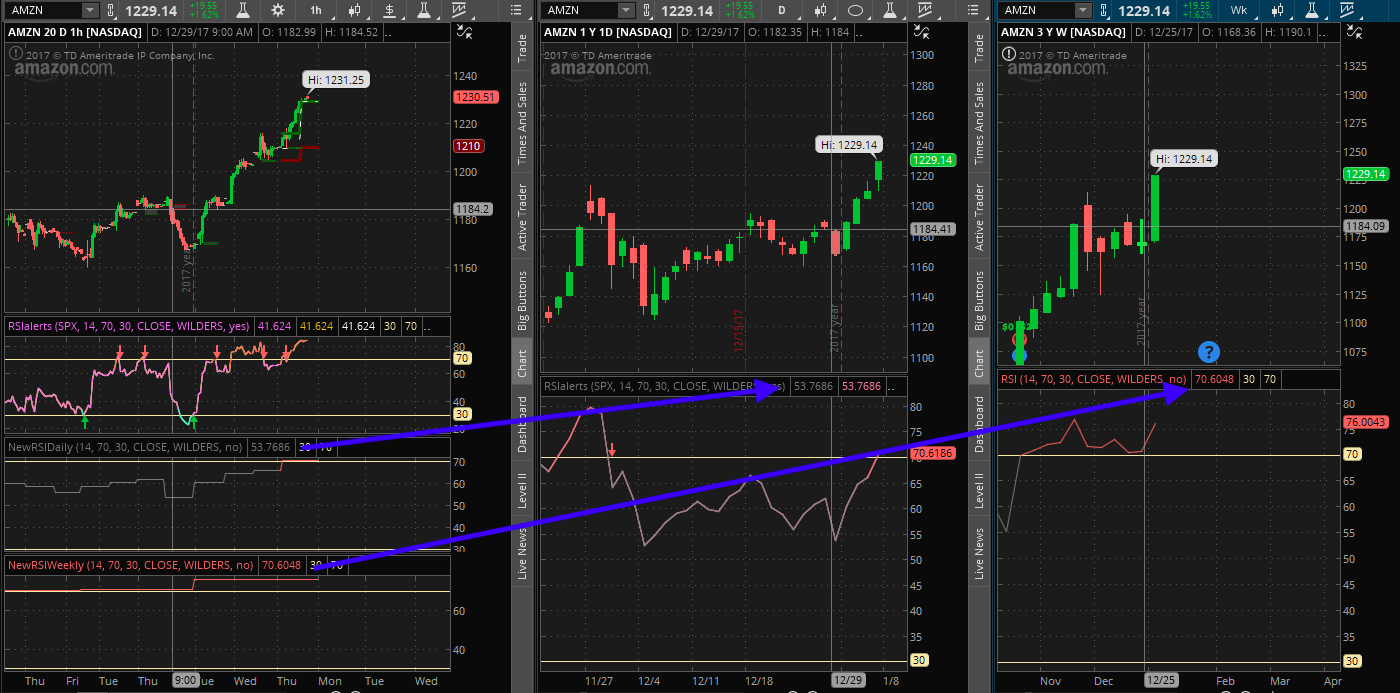
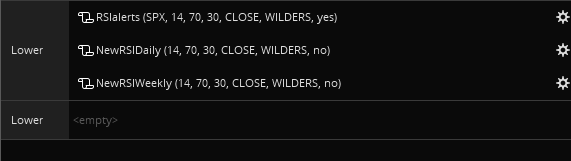
Using the share link you provided, I downloaded your custom study and examined the code. I can see where the errors are. However I can’t help but notice in the screenshot you provided that you clearly have RSI code that plot daily and weekly time frames. Those are working correctly. However I suspect you simply made copy errors when trying to group them all together into the same study. Let’s break this down into pieces. I perceive you will benefit more from me treating this as an opportunity for instruction rather than just give you the answers. First we’ll look at the section that is supposed to be for the daily time frame:
The first error is found on the very last statement. You define DailyChgRatio but mistakenly use elements from the chart time frame for it’s computation. It should read:
The same mistake is found for the weekly. I won’t repeat that code here, but you should see the changes that are required. The next mistakes are found in the plot statements. Once again, we’ll just take a peak at the daily time frame.
You see here you are mixing the chart time frame RSI with the daily change ratio. We can look to the standard RSI implementation to understand how to fix this:
I’ll give you time to let this all settle in and get things patched up and working. Just post a reply in the comments section of this answer when you are ready for me to explain how to achieve the items mentioned in item 2 of your question. Marked as spam
Answered on January 6, 2018 3:48 pm
|
|||||
|
Private answer
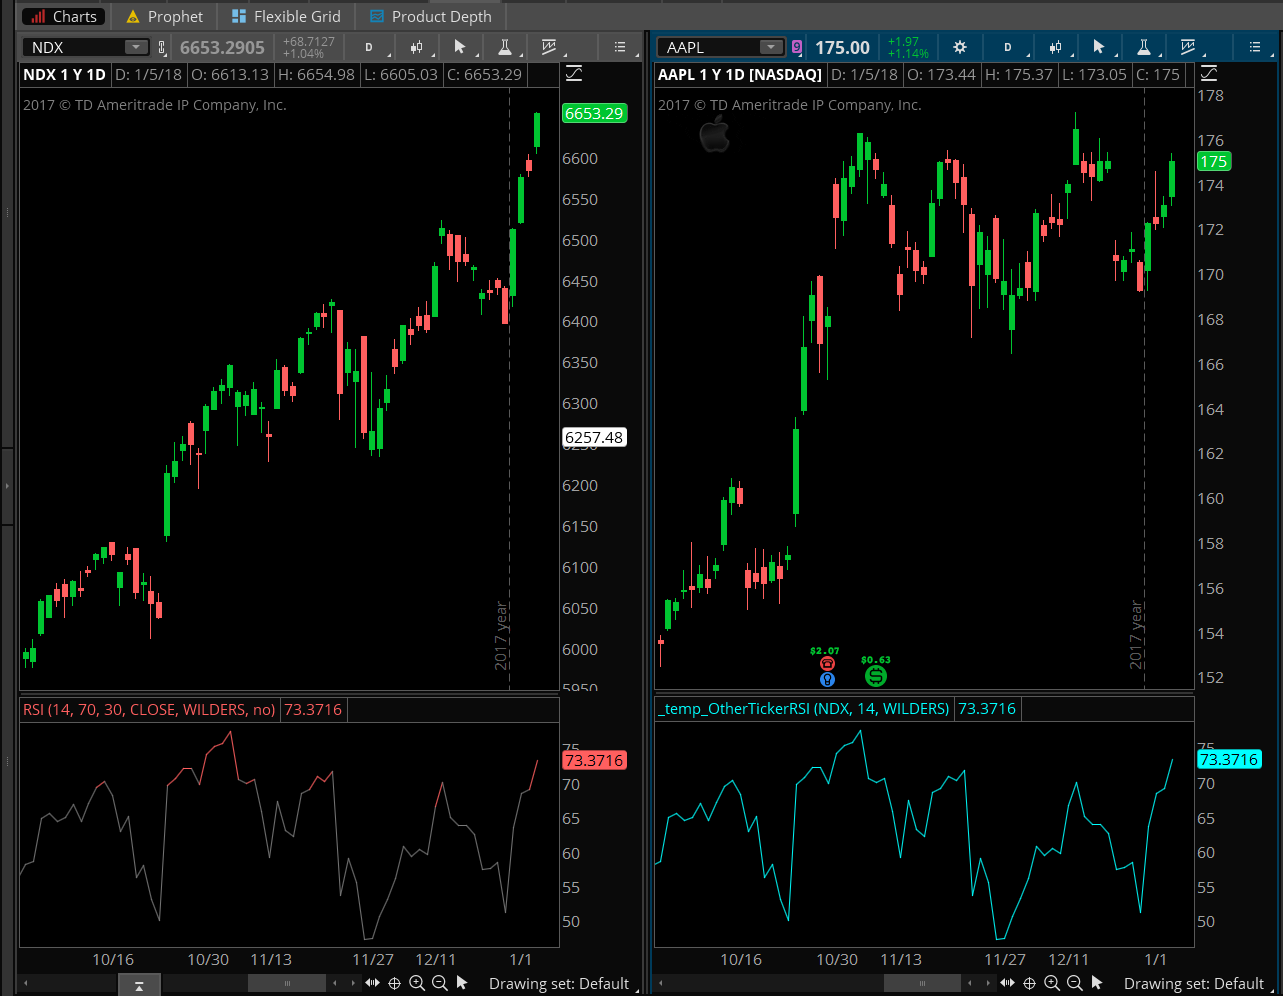
Ok, for the solution to item 2 I will cut the RSI code down to the very bare minimum. I will also exclude the Multiple Time Frame tricks described in my first response. The idea here is make sure it is very easy for you to spot the changes required to get the RSI to plot for a ticker symbol of your own choosing. Notice there are two ways to do the user input for the ticker symbol. I have included both, but one is marked out as a comment. That’s the one that would let you enter any ticker symbol you want. The one that is active creates a list that limits the selection to three ticker symbols. Here is the code:
Screenshot below shows the output. Chart on the left is NDX, with standard RSI. Chart on the right is AAPL with this custom study applied. Attachments:
Marked as spam
Answered on January 7, 2018 9:38 am
|
We’re going to have to change the title of your question. “RSI Aggregate”is not necessarily inaccurate (depends on how visitors interpret that phrase). The standard term used to describe what you are working with is “Multiple Time Frames”. This term deals with the method of grouping multiple aggregation periods together in the same chart study. Aggregation, in this context means the time frame. So if we use the phrase “Multiple Time Frame” we are certain that everyone of our future visitors are going to understand the context perfectly.