rsi closes below 5 for 5 Consecutive bars in a row


Category:
0
0

I am trying to write a scan that will locate a stock with the RSI below 5 for day days in a row starting at the close of the current day and going back for five days.

plot scan = RSI(“length” = 2, “over sold” = 5).”RSI” is less than RSI(“length” = 2, “over sold” = 5).”RSI” for five consecutive days;
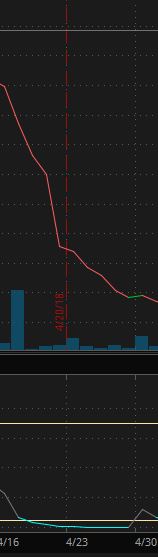
 

Attachments:
Marked as spam
Posted by (Questions: 1, Answers: 0)
Asked on February 2, 2019 3:03 pm
147 views
0
Private answer

This should do it. Have not tested it though.

input length = 2;
input over_Bought = 70;
input over_Sold = 5;
input price = close;
input averageType = AverageType.WILDERS;
def netChgAvg = MovingAverage(averageType, price - price[1], length);
def totChgAvg = MovingAverage(averageType, AbsValue(price - price[1]), length);
def chgRatio = if totChgAvg != 0 then netChgAvg / totChgAvg else 0;
def rsi = 50 * (chgRatio + 1);
def rsiBelowOversold = rsi < over_sold; plot scan = Lowest(rsiBelowOversold, 5) > 0;

Marked as spam
Posted by (Questions: 37, Answers: 4086)
Answered on February 6, 2019 9:31 am