| ♥ 0 |
Hello Hahn, I was wondering if you could help with the following custom column watch list:
Thanks, Yinhosan RESOLVED
Marked as spam
|
|
Private answer
Sure thing. I’ll assume you are using the code from the RSI study that comes with Thinkorswim. I will also assume you have viewed our videos located in the “Thinkorswim Watchlist” category. I will just plot the single line needed to color the background. Quick note, the RSI contains three plots and we only want to have a single plot. So you will need to comment out or delete the OverSold and OverBought plot statements. Then comment out or delete the style statements for those plots. To the bottom of the existing code (after modifications listed above) you will add:
Final comment: There is a statement near the bottom of the existing study that colors the plot of the RSI. That statement begins with You can read more about the GetColor() function here: http://tlc.thinkorswim.com/center/reference/thinkScript/Functions/Look---Feel/GetColor.html Be sure to up-vote any answers that best solve your question. Marked as spam
Answered on January 29, 2017 9:41 am
|
|
|
Private answer
sorry i didn’t let you know that i don’t have the code RSI study that comes with Thinkorswim. Would you please copy/paste the entire code right here as I don’t know anything about coding? Thank you Marked as spam
Answered on January 29, 2017 10:02 am
|
|
|
Private answer
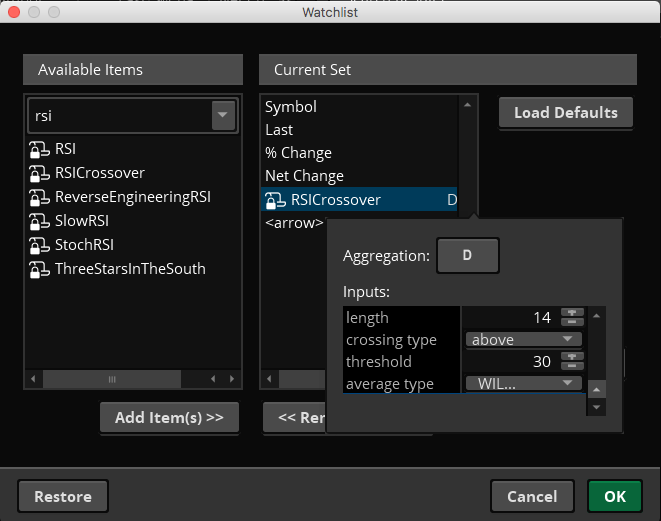
For those who don’t want to work with the code, there is a built in column you can add to a watchlist. It’s called “RSICrossover”. Screenshot below shows this column being added to the current set, and the parameters have been opened to display the inputs. You merely need to select your aggregation period, length, crossover type and threshold. You will need to add two columns to accomplish the specified goal. One will be a crossing type Above and the other will be a crossing type Below. The only thing lacking is it does not show a color change, it only shows a value of 1 or 0 depending on if the condition is present. But for those who don’t know anything about the code, this is the best option. Attachments:
Marked as spam
Answered on January 29, 2017 11:19 am
|
Just adding full working piece of code.
#
# TD Ameritrade IP Company, Inc. (c) 2007-2017
#
declare lower;
input length = 14;
input over_Bought = 70;
input over_Sold = 34;
input price = close;
input averageType = AverageType.WILDERS;
input showBreakoutSignals = no;
def NetChgAvg = MovingAverage(averageType, price – price[1], length);
def TotChgAvg = MovingAverage(averageType, AbsValue(price – price[1]), length);
def ChgRatio = if TotChgAvg != 0 then NetChgAvg / TotChgAvg else 0;
plot RSI = 50 * (ChgRatio + 1);
AssignBackgroundColor(if RSI > 68 then Color.RED else if RSI < 32 then Color.BLUE else Color.BLACK);
Well done, thank you!