RSI strategy orders not lining up


Category:
0
0

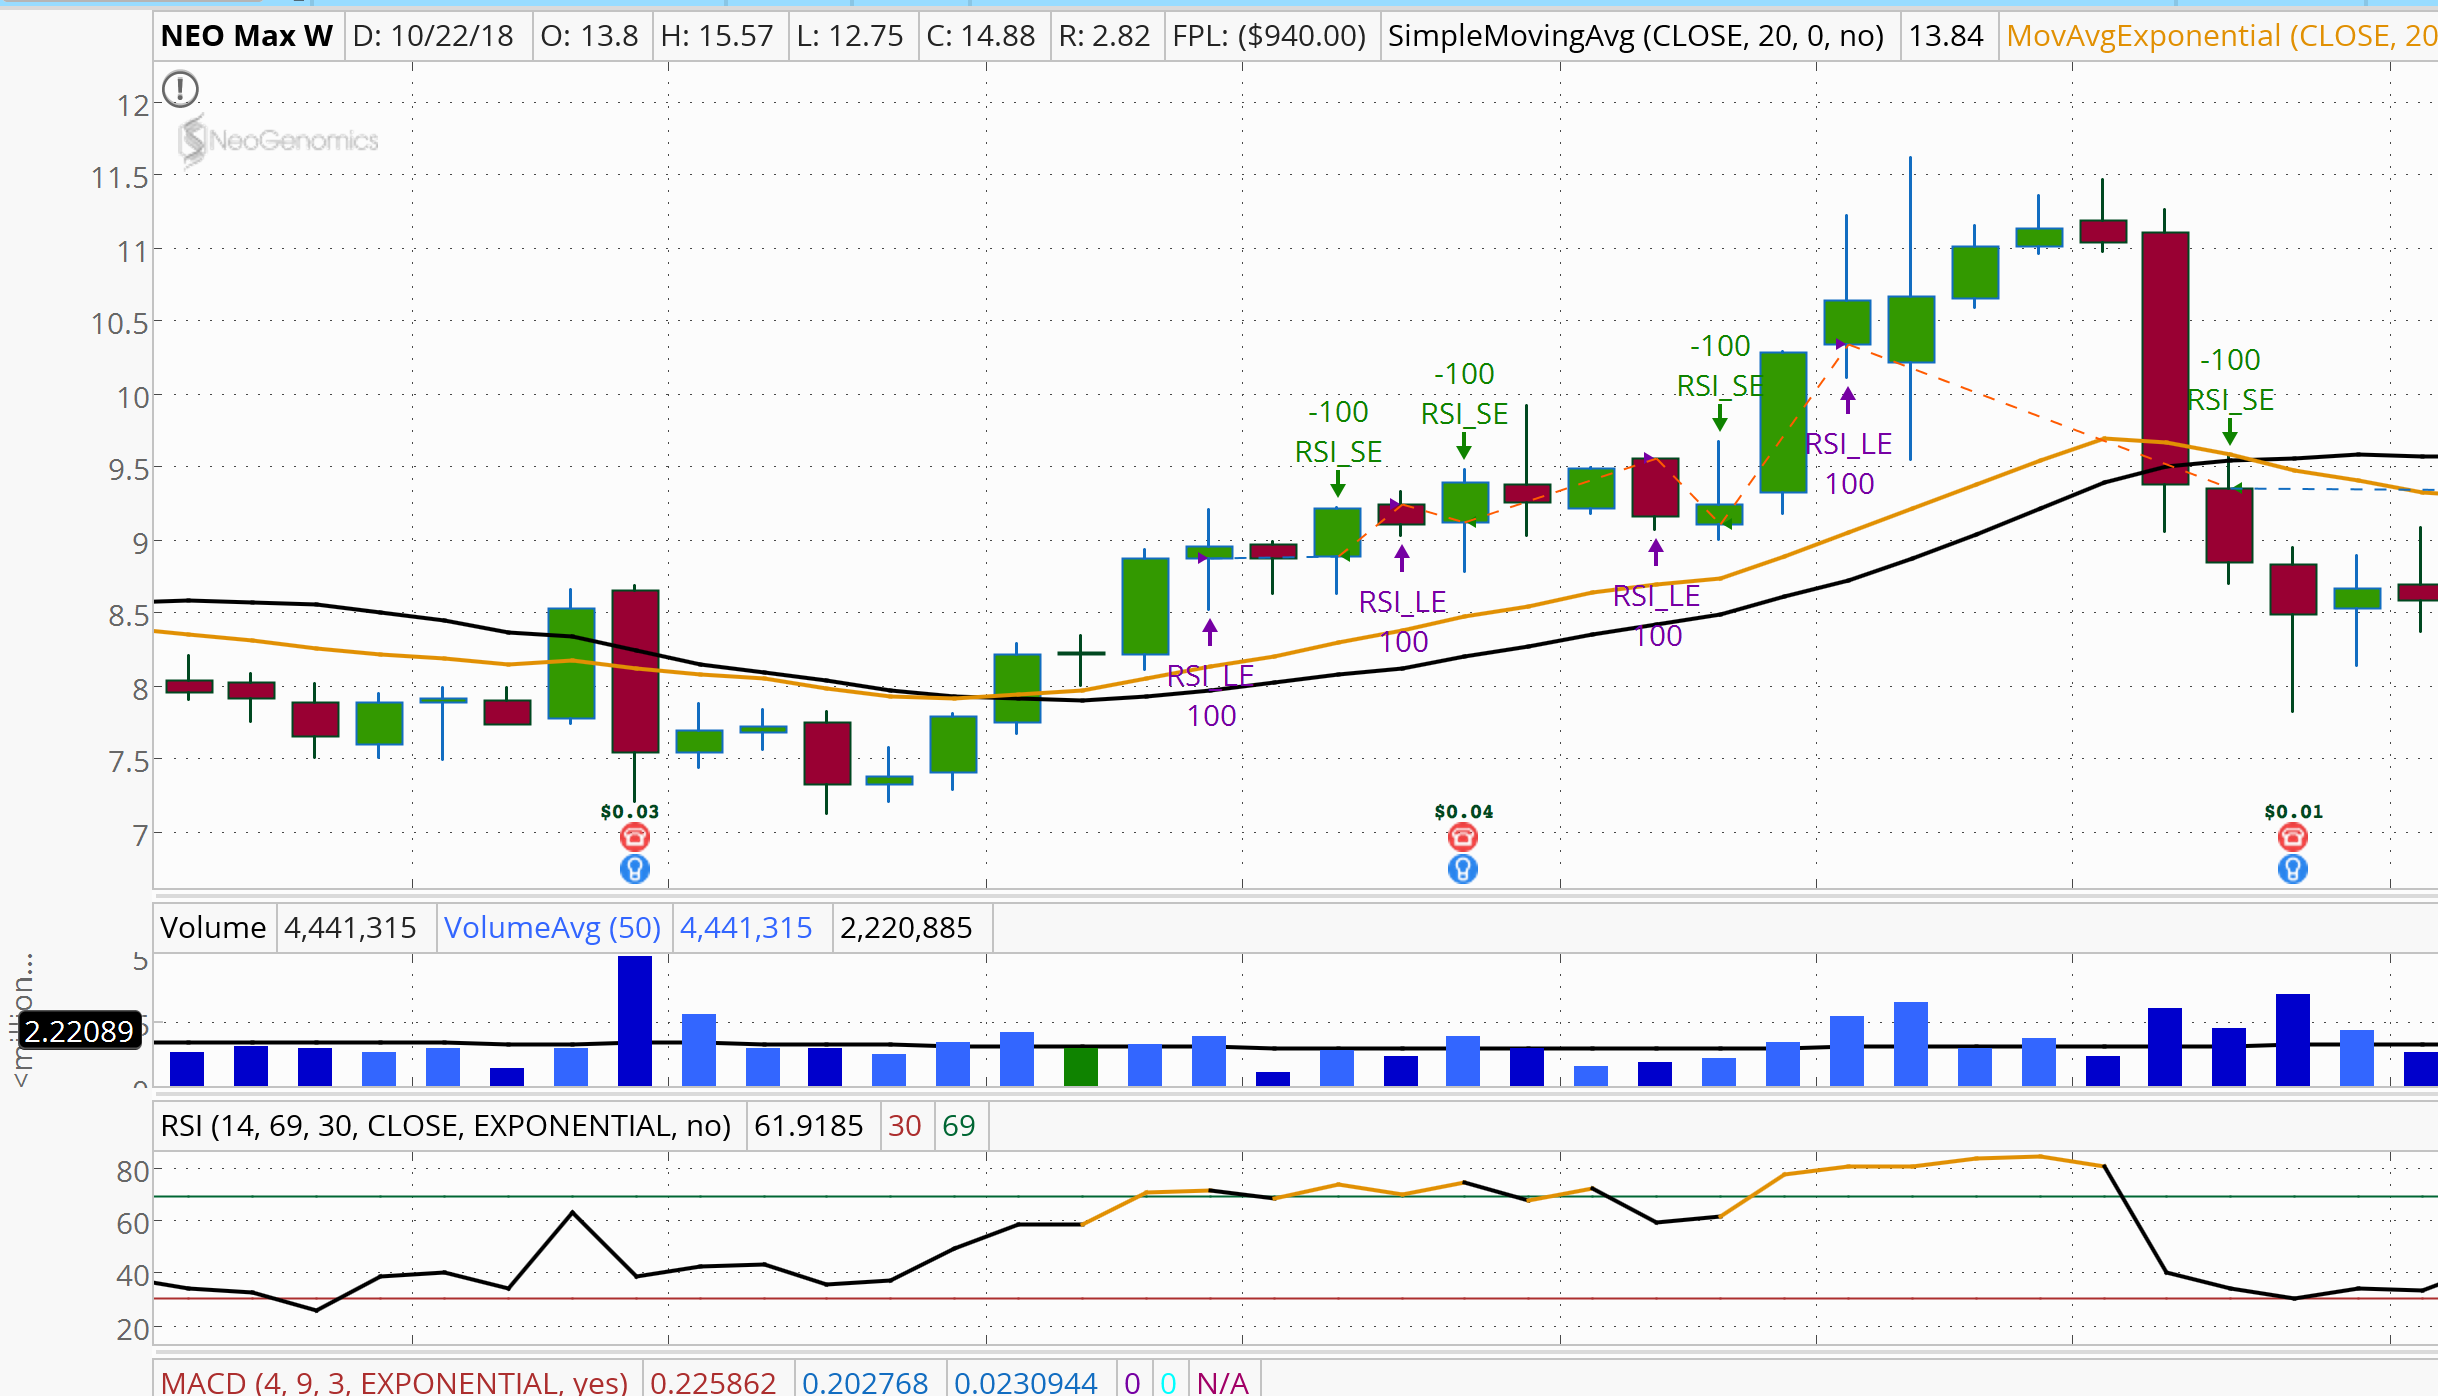
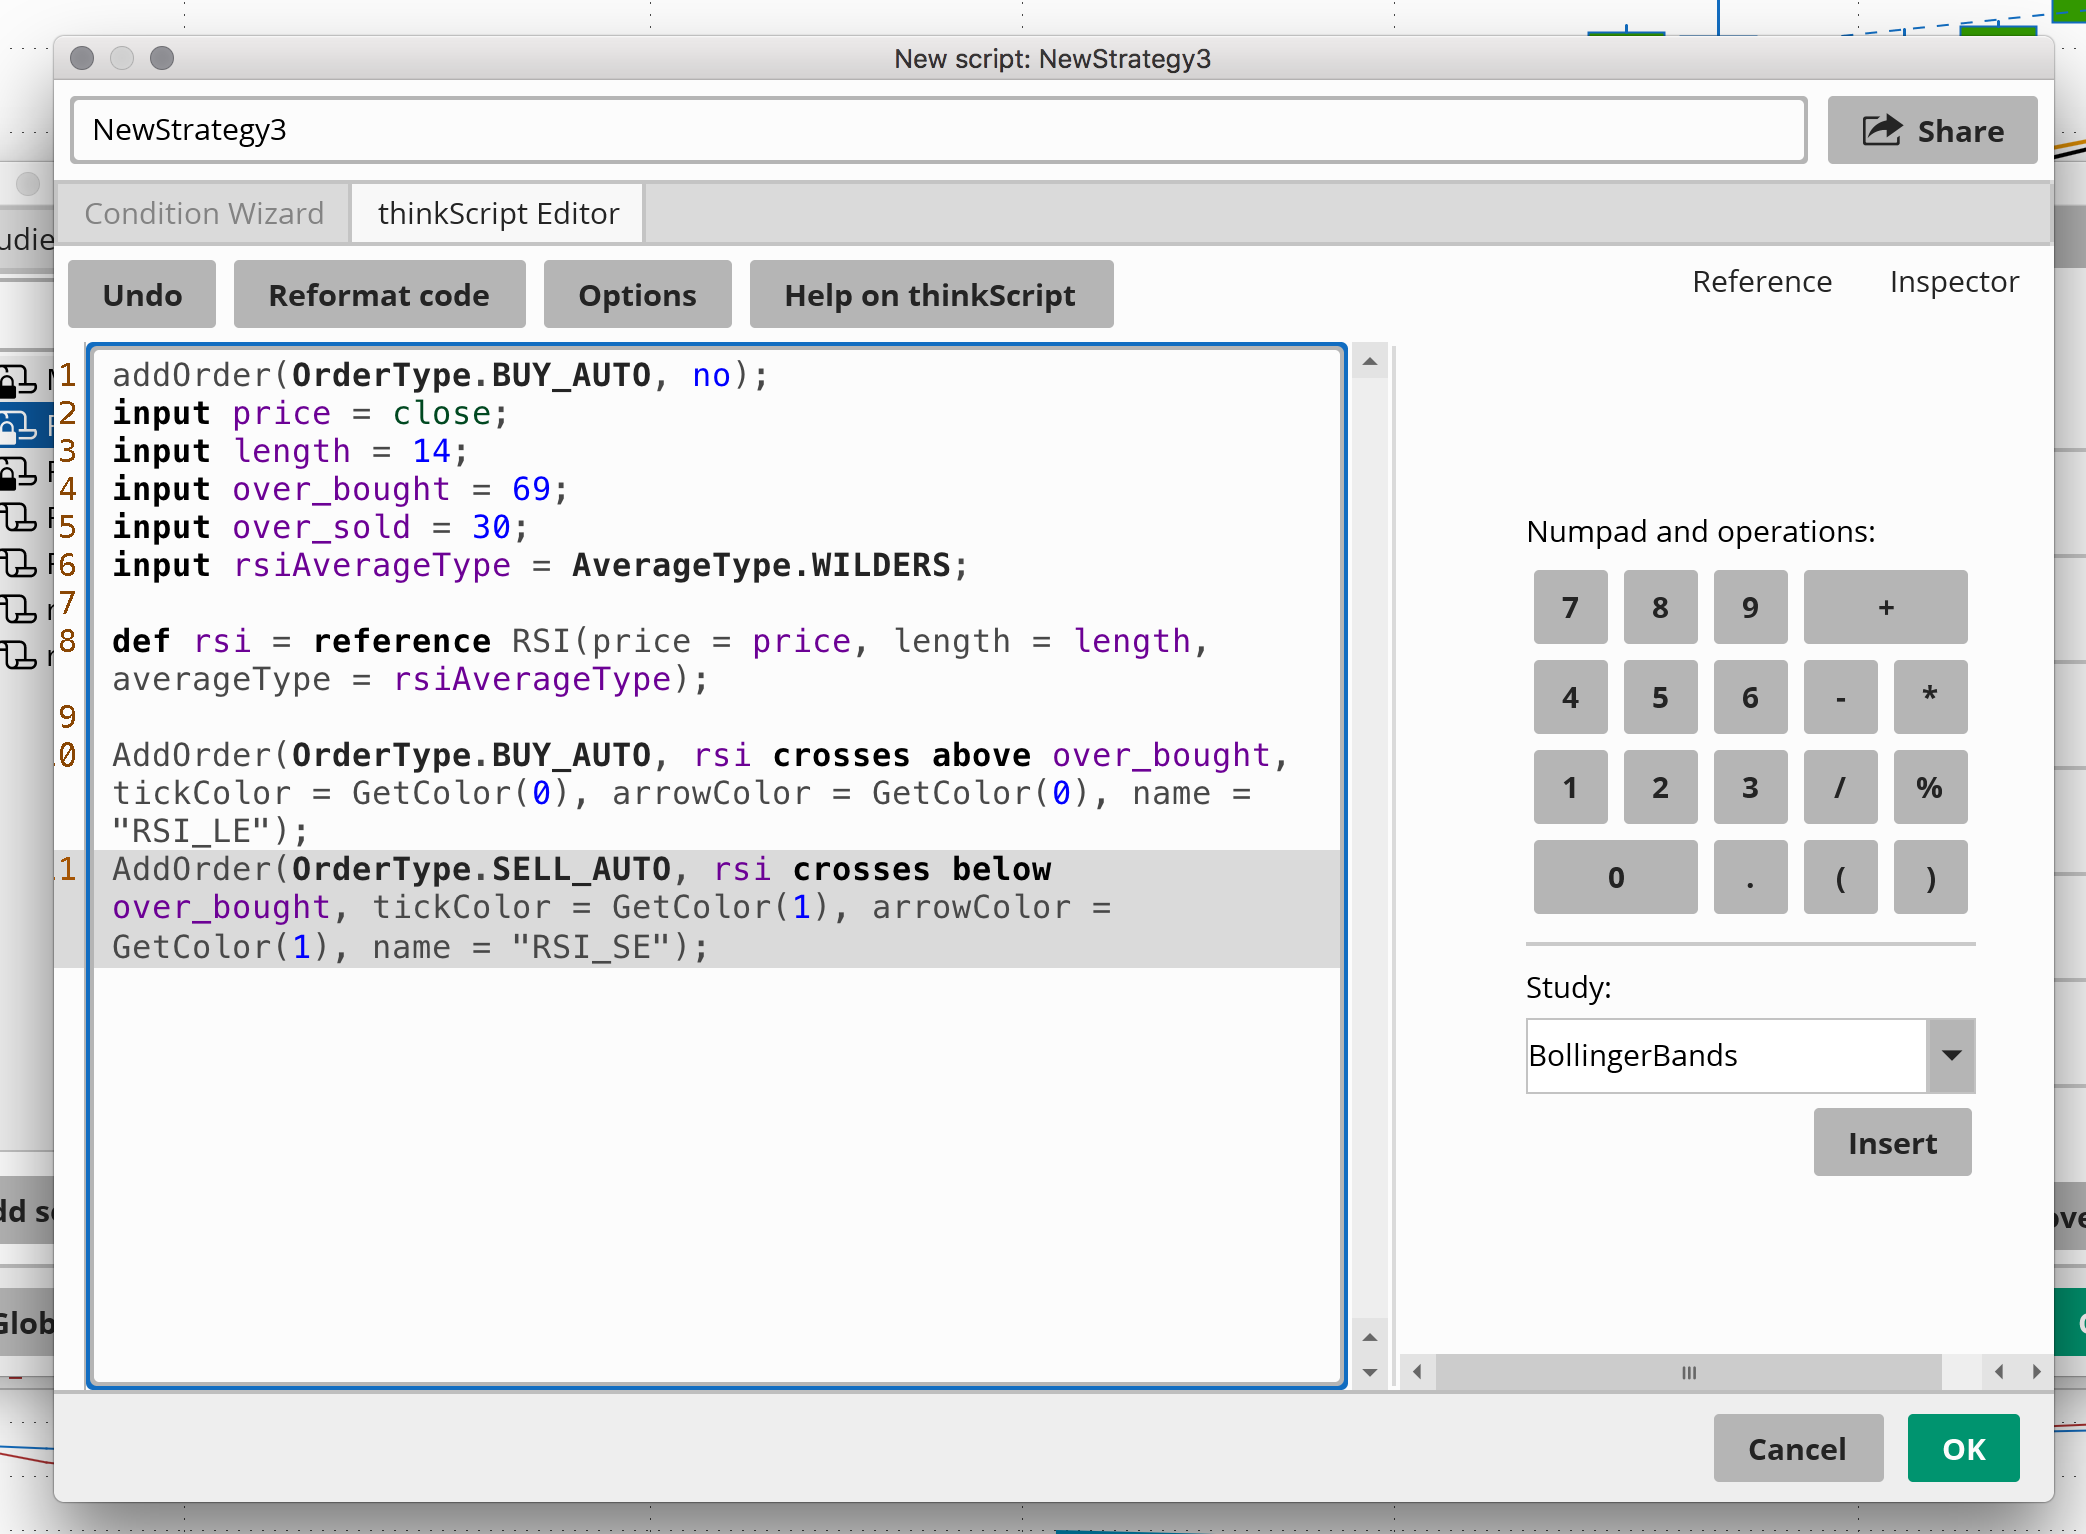
Hello There Pete,

Im just getting into strategies and am trying to create one that simply buys when Rsi crosses 69 in the upward direction, and then executes the sell once it falls below same 69 level. Thought things were going alright till noticing that the Buys and Sells don’t line up with the 69(s) on the Rsi Lower Study.  Tried what I could to fix and searched for help but to no avail.
Your help would be greatly appreciated. Hope the screenshots help.

Attachments:
Marked as spam
Posted by (Questions: 11, Answers: 15)
Asked on October 25, 2018 10:09 pm
116 views
0
Private answer

Very simple mistake. You left out the inputs for overbought and oversold when referencing your rsi study. This is why it usually best to use the full source code instead of referencing a study.

If you are going to reference a study, it’s usually best to build that in the condition wizard, because something like this will not be missed. And if you build your signals in the condition wizard, you should be watching our videos on this topic. Where you will find a template used to convert signals built using the condition wizard directly into strategy orders.

Here is your line of code missing the essential inputs:

def rsi = reference RSI(price = price, length = length, averageType = rsiAverageType);

Here is what it looks like when you include all the arguments, in their correct order (hint, this means you don’t have to label each one).

def rsi = RSI(price, length, over_bought, over_sold, rsiAverageType).RSI;

When you don’t include the overbought and oversold inputs, the code will use the default values of 80/20.

Marked as spam
Posted by (Questions: 37, Answers: 4079)
Answered on October 26, 2018 7:50 am
0
Yup, that is what I was missed. Should I be replacing that line of the script? I tried doing so but came out invalid. I watched the Strategy videos and tried it out from the condition wizard. I got a nice statement that plots 69 cross overs as a ‘spiking’ line but.. I don’t know enough to turn it into what I want, as copy and pasting the parts I think I need hasn’t been working. Also tried adding the over bought/sold statements to my original faulty code, but the plot was still off.. thinking I need to start from zero and learn think script basics. My bogus code below.. input price = close; input length = 14; input over_bought = 70; input over_sold = 30; input rsiAverageType = AverageType.WILDERS; def rsi = RSI(price, length, over_bought, over_sold, rsiAverageType).RSI; AddOrder(OrderType.BUY_AUTO, rsi crosses above over_sold, tickcolor = GetColor(0), arrowcolor = GetColor(0), name = “RSI_LE”); AddOrder(OrderType.SELL_AUTO, rsi crosses below over_bought, tickcolor = GetColor(1), arrowcolor = GetColor(1), name = “RSI_SE”);
( at October 26, 2018 9:54 pm)
0
Private answer

Should have just done it this way from the start. Even I missed one of the required inputs, “showBreakOutSignals”.

So lesson learned. When you are writing code, don’t use shorthand. Use the full code directly from the built-in study provided by Thinkorswim:

input length = 14;
input over_Bought = 70;
input over_Sold = 30;
input price = close;
input averageType = AverageType.WILDERS;
input showBreakoutSignals = no;
def NetChgAvg = MovingAverage(averageType, price - price[1], length);
def TotChgAvg = MovingAverage(averageType, AbsValue(price - price[1]), length);
def ChgRatio = if TotChgAvg != 0 then NetChgAvg / TotChgAvg else 0;
plot RSI = 50 * (ChgRatio + 1);

Marked as spam
Posted by (Questions: 37, Answers: 4079)
Answered on October 26, 2018 10:32 pm
0

Ill do my best to follow that.

Thank you for the help Pete.
Your tutorials have given me much insight as well as inspiration to learn more.
Ill be sure to voice support for your channel on Youtube as I continue through
all of your kick butt content.
Thanks again

( at October 27, 2018 12:31 pm)