| ♥ 0 |
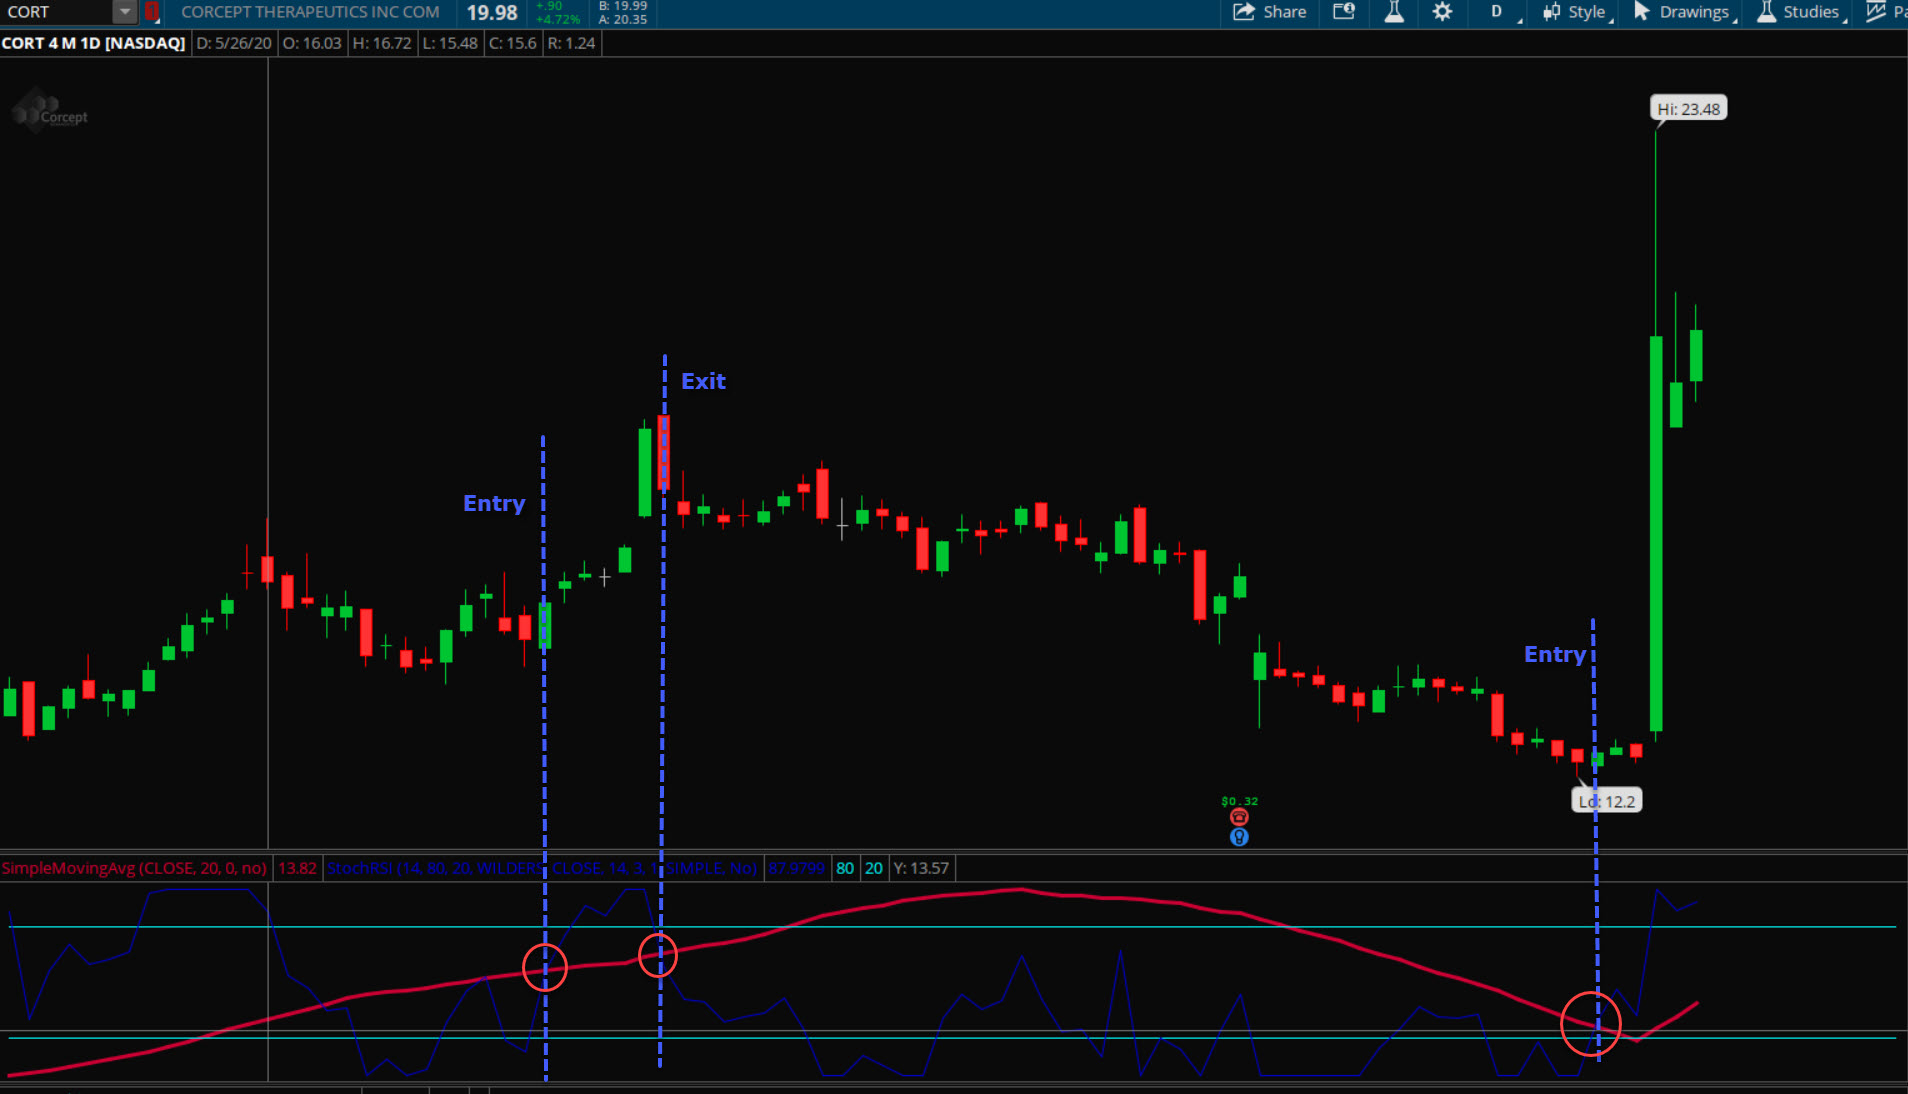
Hi Pete, I’m creating a strategy where the StochRSI(14) value is crossing above 20SMA as an entry point and StochRSI(14) crossing below 20SMA as an exit point. See the image attached and I have tried this for few other stocks and looks promising. I would like to have a scan to identify the stocks where the StochRSI is crossing above 20SMA. Would it be possible to have one? Thank you so much for all your help. Attachments:
Marked as spam
Asked on September 6, 2020 5:56 pm
133 views
|
|
Private answer
When you overlay an upper chart study onto a lower chart study the only thing you create is an optical illusion. There are no crossovers on the lower subgraph of your chart. Those two lines never even come close to touching one another. I created the following post to explain why we should never do this: https://www.hahn-tech.com/ans/overlay-one-study-onto-another-for-crossover-signals/
Marked as spam
Answered on September 6, 2020 7:22 pm
|