Scan for MTF MACD Green Histogram DOWN and Red Histogram UP


Category:
0
0

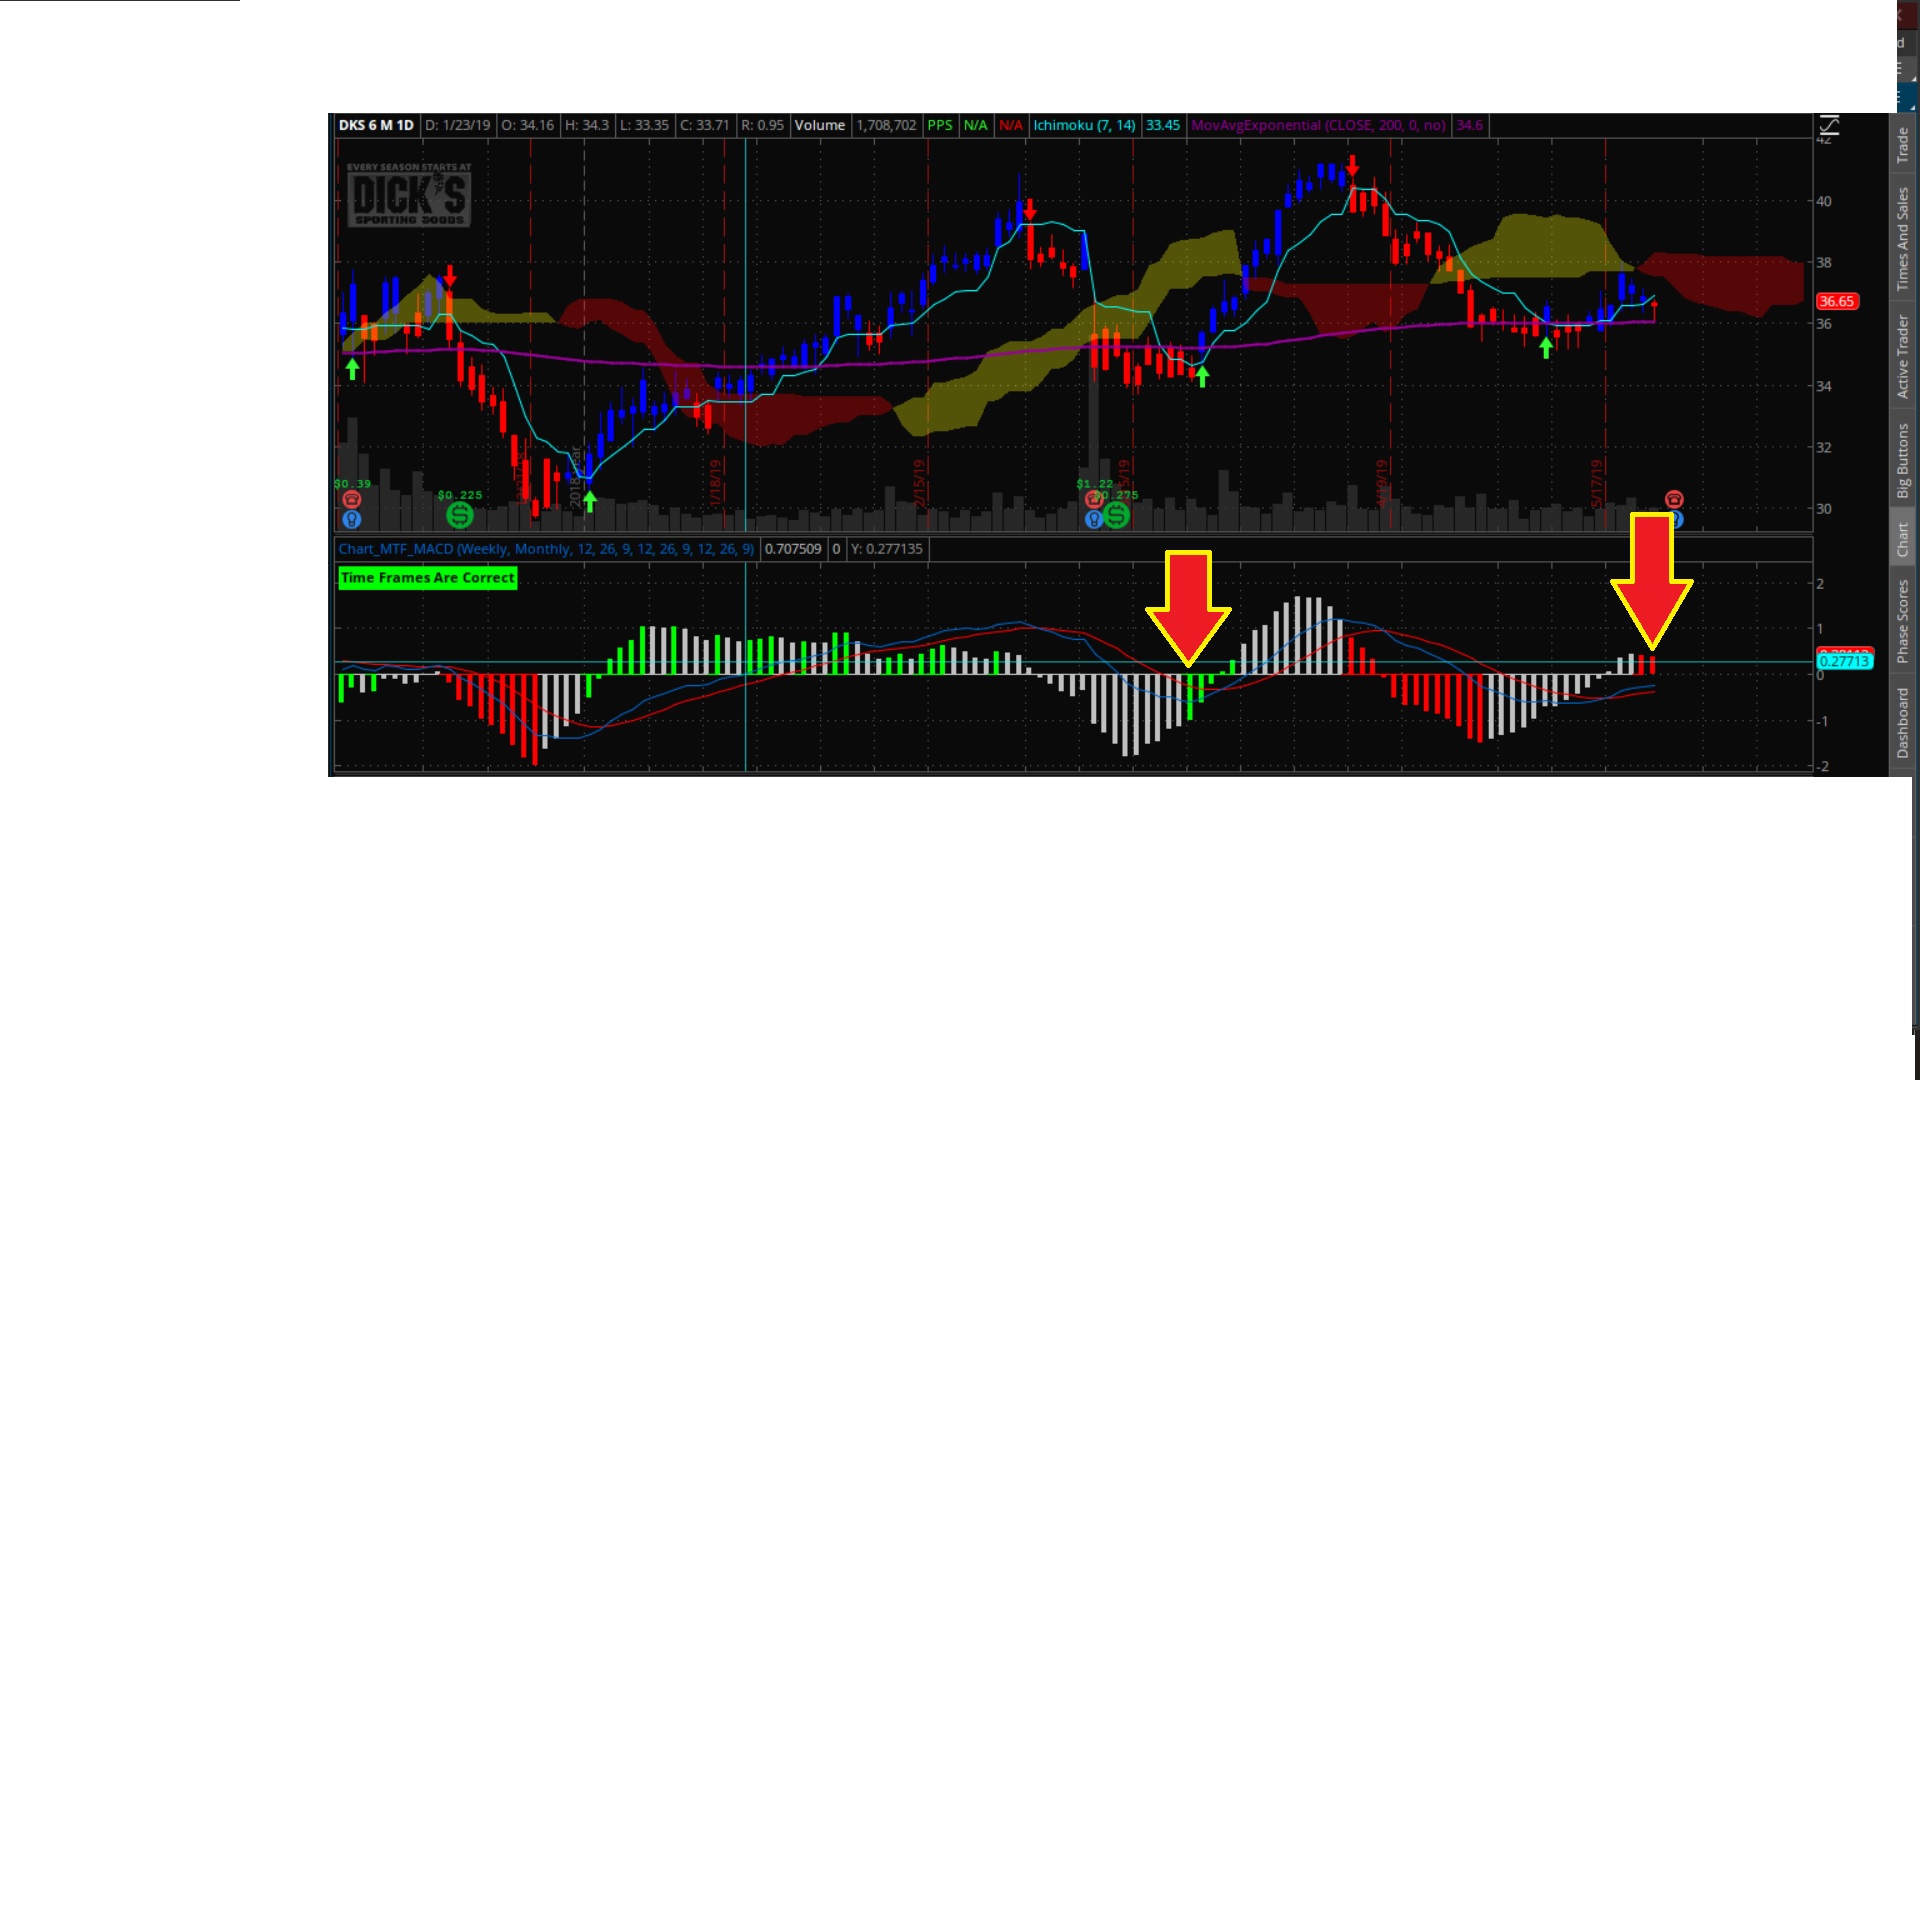
Hi Pete,

Can you please modify your MTF MACD stock scan to search for stocks that have the red and green histogram when the green one is down or when the red is up. Somewhat opposite of normal I suppose. Here is a screen shot with arrows so you can see what I mean. I use the daily chart with the settings on Day, Week, and Month.

Thank you!

John

Attachments:
Marked as spam
Posted by (Questions: 1, Answers: 2)
Asked on May 27, 2019 1:27 pm
289 views
0
Thank you for posting the link and for the code! You are a truly great! Just to be clear, do I post this code in all 3 time frames vs in your original you linked above, you had some separate code for the Day period? Do I need to set up 2 separate scans, one for the way you have the code above and another once I move the "#" to the other plot line? Sorry of this is obvious to most, I am a bit new on interpreting code. I am looking for the last painted bar in my scan to be green down or red and up in the 3 time frames. Thanks again Pete!
( at May 28, 2019 3:35 pm)
0
Yes, you will use this one section of code for all three time frames that are described in the article. You will also need to save two separate scans, one for the green bars and one for the red bars.
( at May 28, 2019 4:33 pm)
0
Private answer

When referencing something from the internet it is always best to provide a link. Remember this post is intended to provide solutions for our entire audience of traders. They may not know what you are referring to "MTF MACD Scan". So here is the link to that post on our site:

https://www.hahn-tech.com/thinkorswim-mtf-macd-scan/

So in order to complete this solution you will need to read that article I linked above. Then apply this code which has been modified as requested:

input fastLength = 12;
input slowLength = 26;
input MACDLength = 9;
input averageType = AverageType.EXPONENTIAL;
def Diff = MACD(fastLength, slowLength, MACDLength, averageType).Diff;
plot scan = Diff[1] > Diff[2] and Diff[1] < 0;
# OR
#plot scan = Diff[1] < Diff[2] and Diff[1] > 0;

You see what I changed? All I did was to add a condition that forces the green histogram bar to be below the zero line. And likewise, the red histogram bar has to be above the zero line.

Marked as spam
Posted by (Questions: 37, Answers: 4086)
Answered on May 28, 2019 11:55 am
0
Hi Pete, After tying this out for a few days with all 3 time frames in one scan and then another separate scan with 3 time frames with the "#" moved to the other plot scan code, I get nothing most of the time. (I am using month, week, and day) When I search manually, I do find about 15 for every 900 stocks. I am not sure why its not working very well for me. I found 2 one time with it but there were quite a bit more when I searched manually.
( at May 31, 2019 8:30 am)