Scan for price X bars from daily High


Category:
0
0

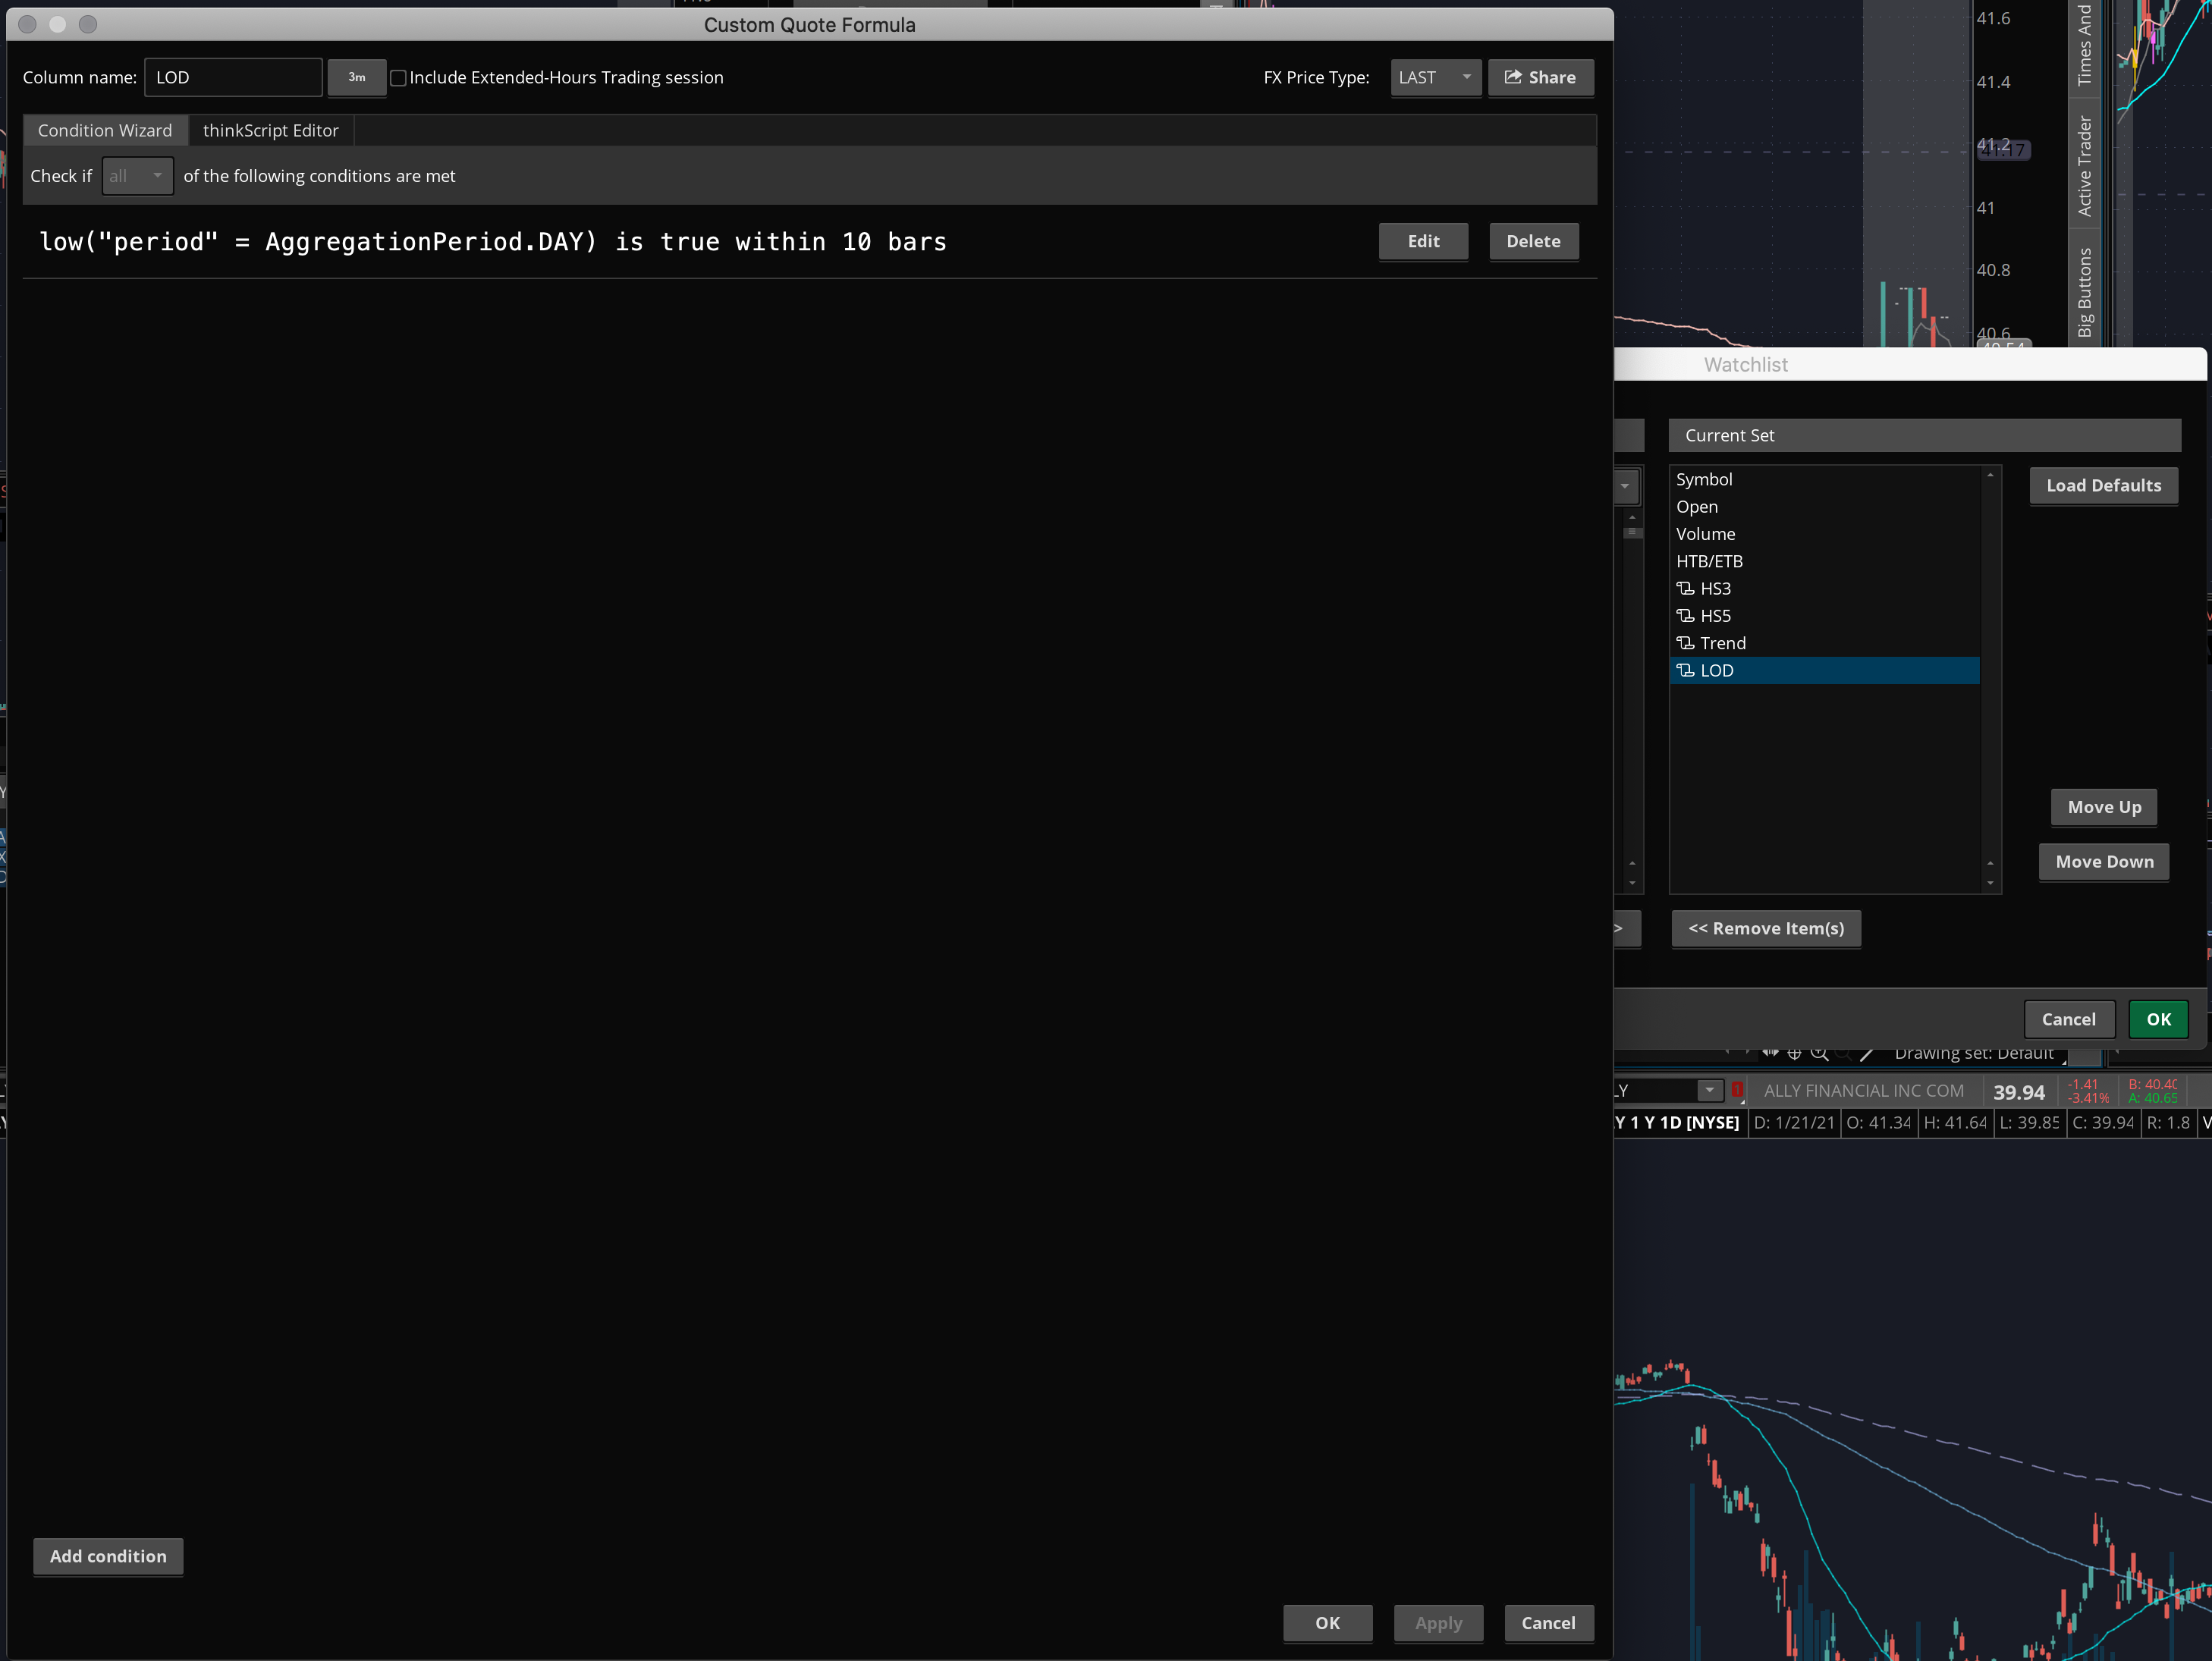
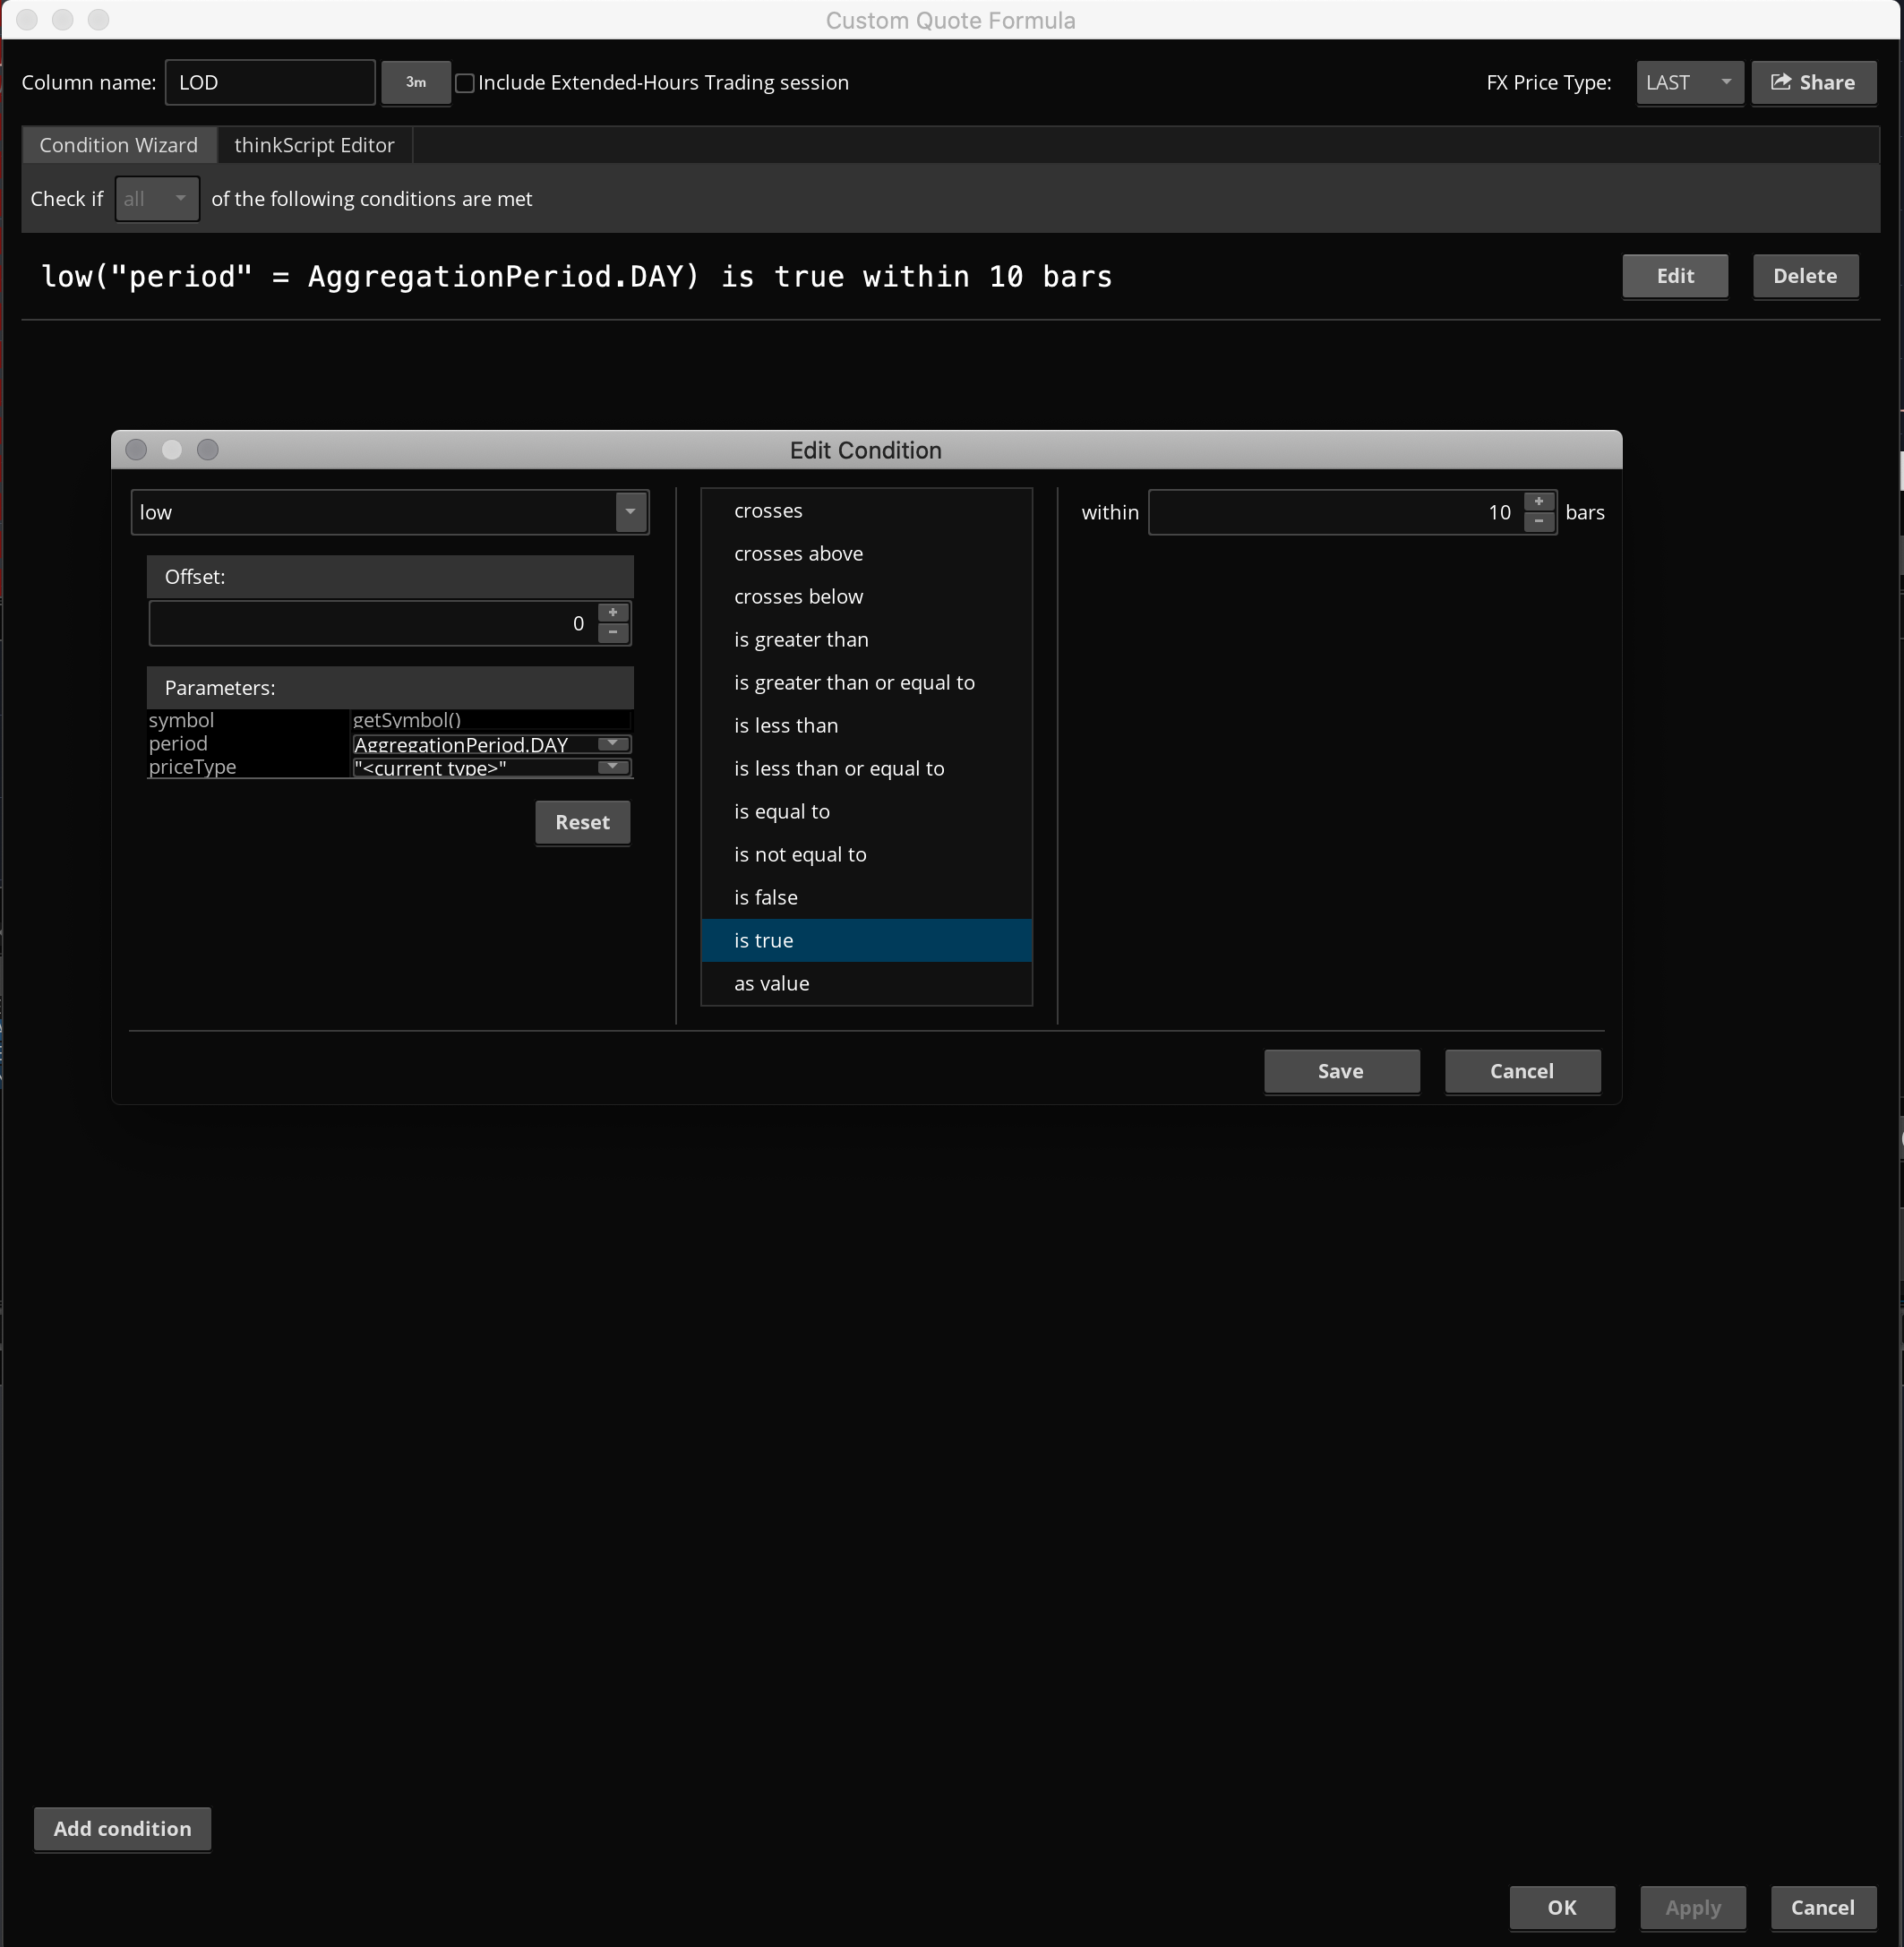
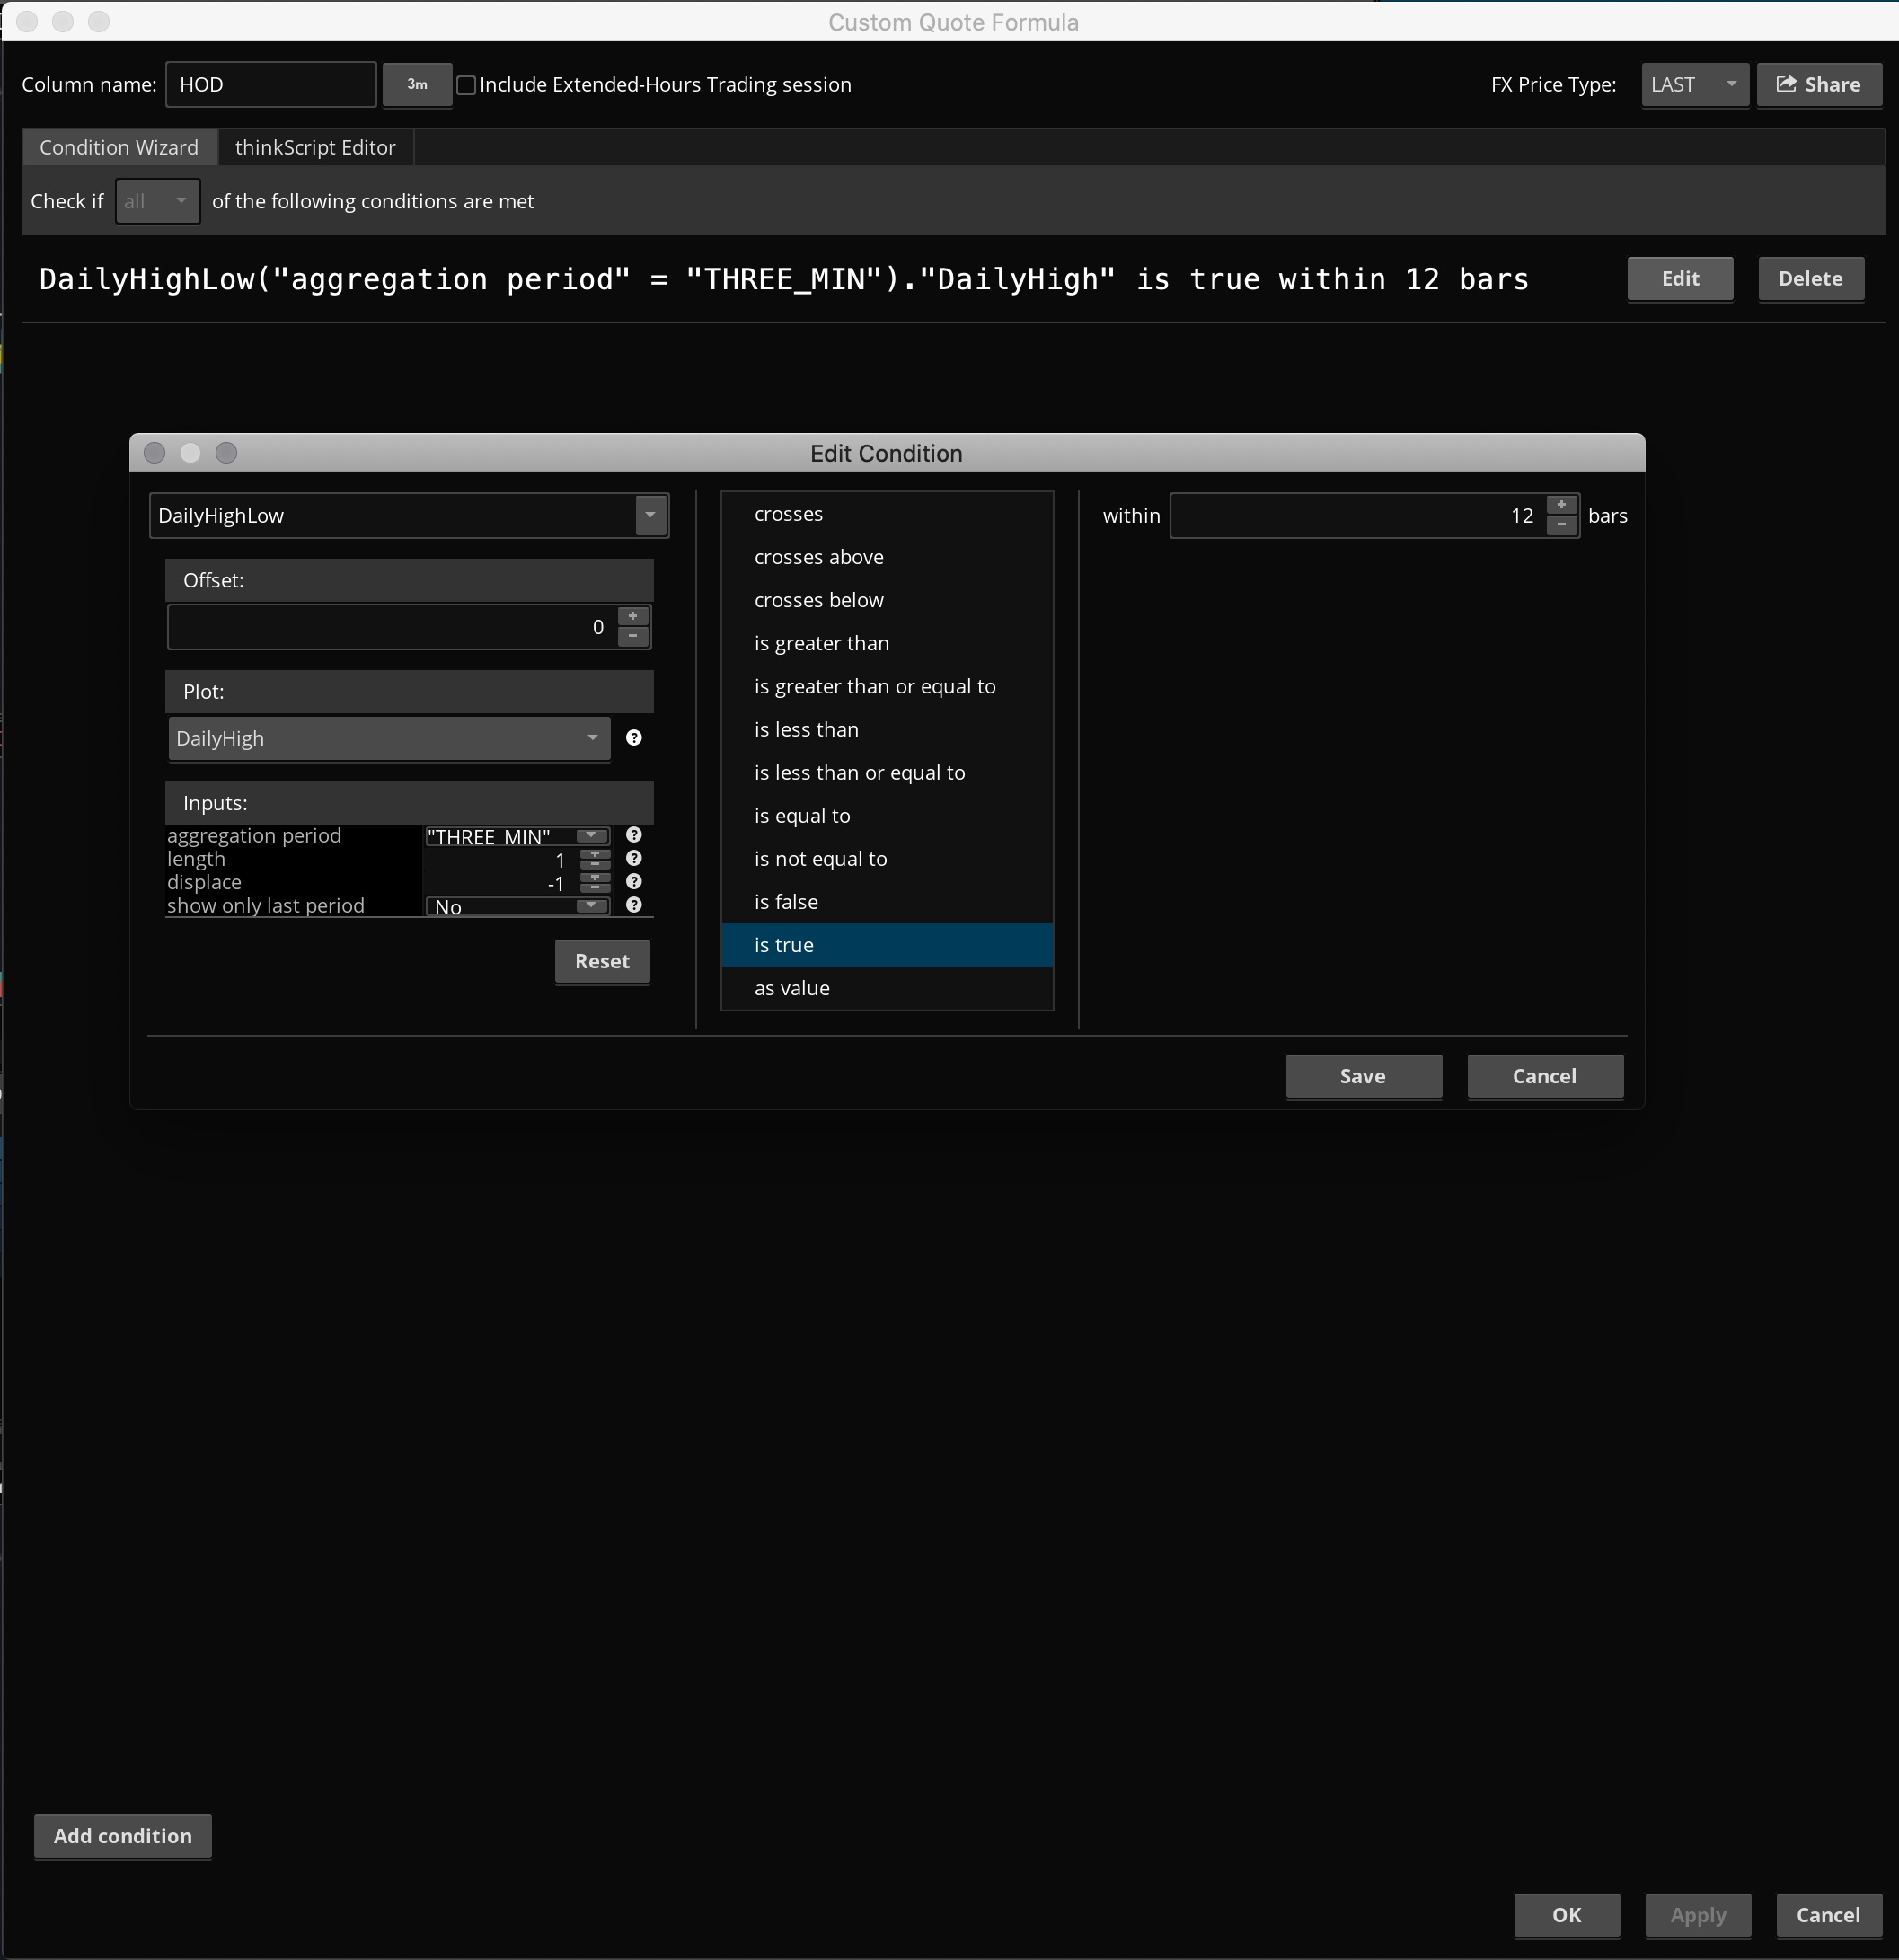
Hello Again,

Im trying to refine the results of a Trend scan I made. Id like to add a condition where price is within 10 3min bars of the days high.  I have a condition that returns how many bars the 20 Ema has been trending up or down and Im hoping that by adding this condition I will filter out some off the EMA trends that are ‘chop’.       So instead of trying to define Higher highs and higher lows I figures I could use my own discretion with stocks near their days highs, time wise that is.

Been trying to get it done with the condition wizard.   Im guessing my problems lies in the aggregate periods?

Thanks again for any advice!

Attachments:
Marked as spam
Posted by (Questions: 11, Answers: 15)
Asked on January 21, 2021 6:07 pm
119 views
0
Private answer

You cannot use secondary aggregation periods in the Study Filters of scans on Thinkorswim. The code will have to use recursion in order to track the daily high. Then it will need to count the number of bars that follow that recent high. Your scan would then return a list of stocks that are less than 10 bars away from that high.

The following code will perform that filter and can be applied to a separate Study Filter all by itself. Start with that and then add new Study Filters with whatever your other conditions you want to include.

Edit: This code has been corrected after discovering an error in the way the count bar function was computed.

input withinBars = 10;
def newDay = GetDay() <> GetDay()[1];
rec trackHigh = if newDay then high else if high > trackHigh[1] then high else trackHigh[1];
rec countBars = if trackHigh > trackHigh[1] then 0 else if trackHigh == trackHigh[1] and high < trackHigh then countBars[1] + 1 else -1;
plot scan = countBars > 0 and countBars < withinBars;

Marked as spam
Posted by (Questions: 37, Answers: 4087)
Answered on January 22, 2021 1:12 pm
0
Can I turn this into a watchlist column as well or are some changes needed? Im trying to no but the results seem off.
( at January 22, 2021 3:14 pm)
0
Before you can modify this to display as a custom watchlist column you first need to determine what you want to display. If you use the code for the scan without modification it will display 1's and 0's. The 1's are for stocks that fit your criteria (within x bars of a recent intraday high). The 0's are for stocks that do not fit your criteria.
( at January 22, 2021 4:01 pm)
0
Only interested in if the condition is met. But its signaling on some stocks that are well past their highs, and not signaling others that are at (near) their days high . AEO for instance, high of day was early in the morning, signal. PHM conversely, pretty much closed at highs, no signal. ill put pictures for the time being in the solution tab.
( at January 22, 2021 4:27 pm)
0
You probably have not set the time frame for the watchlist to match your charts. Also note that if you do not include extended hours data on your charts you will need to turn off the chart setting named "Start aggregation at market open" to OFF. Otherwise your charts will never match any of the other tools on the platform.
( at January 22, 2021 6:26 pm)
0
No, Ive made sure of all that. Thanks again for the code! I'Il keep working at it!
( at January 22, 2021 7:01 pm)
0
I have updated the code in my answer to correct an error that was discovered when evaluating your other request to convert this code to work as a custom watchlist column.
( at January 24, 2021 2:51 pm)