Scan for RSI below 30 and price under lower BollingerBands


Category:
0
0

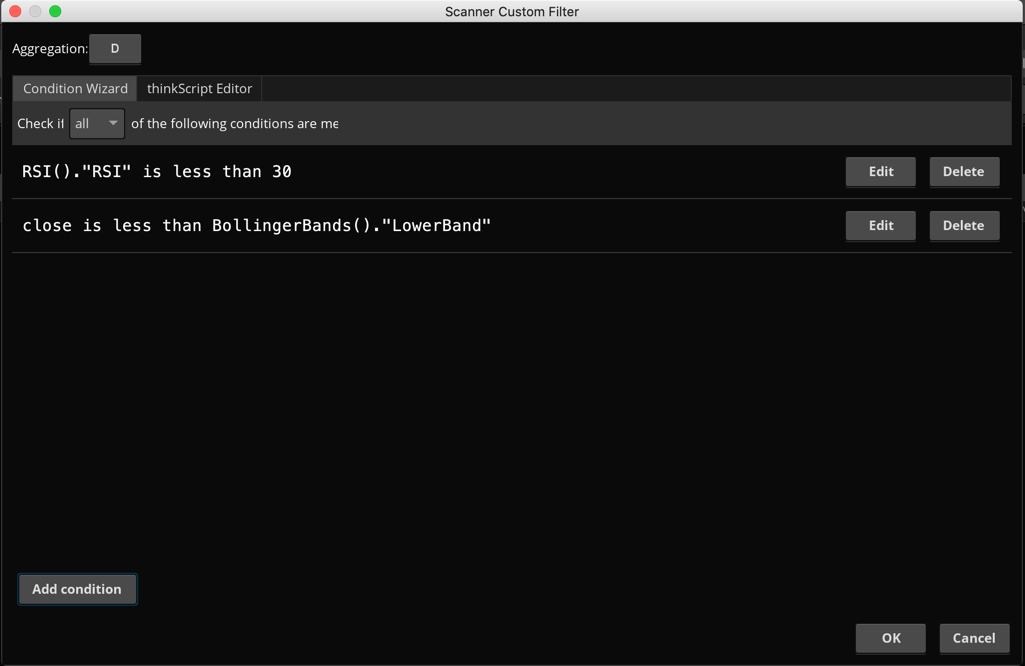
I have been trying to create a scan that shows stocks that are below RSI of  30 and below lowerband of Bollinger Bands. I have some code for the charts that I want to mimic. But the RSI keeps bringing up stocks that are above the RSI of 30.

I think I got this code for you but maybe not. 2 scripts

###First Script
input price = close;
input displace = 0;
input length = 20;
input Num_Dev_Dn = -2.0;
input Num_Dev_up = 2.0;
input averageType = AverageType.Simple;

def sDev = stdev(data = price[-displace], length = length);

plot MidLine = MovingAverage(averageType, data = price[-displace], length = length);
plot LowerBand = MidLine + num_Dev_Dn * sDev;
plot UpperBand = MidLine + num_Dev_Up * sDev;

LowerBand.SetDefaultColor(GetColor(0));
MidLine.SetDefaultColor(GetColor(1));
UpperBand.SetDefaultColor(GetColor(5));

####Second script

declare lower;

input length = 14;
input over_Bought = 70;
input over_Sold = 30;
input price = close;
input averageType = AverageType.WILDERS;
input showBreakoutSignals = no;

def NetChgAvg = MovingAverage(averageType, price – price[1], length);
def TotChgAvg = MovingAverage(averageType, AbsValue(price – price[1]), length);
def ChgRatio = if TotChgAvg != 0 then NetChgAvg / TotChgAvg else 0;

plot RSI = 50 * (ChgRatio + 1);
plot OverSold = over_Sold;
plot OverBought = over_Bought;
plot UpSignal = if RSI crosses above OverSold then OverSold else Double.NaN;
plot DownSignal = if RSI crosses below OverBought then OverBought else Double.NaN;

UpSignal.SetHiding(!showBreakoutSignals);
DownSignal.SetHiding(!showBreakoutSignals);

RSI.DefineColor(“OverBought”, GetColor(5));
RSI.DefineColor(“Normal”, GetColor(7));
RSI.DefineColor(“OverSold”, GetColor(1));
RSI.AssignValueColor(if RSI > over_Bought then RSI.color(“OverBought”) else if RSI < over_Sold then RSI.color(“OverSold”) else RSI.color(“Normal”));
OverSold.SetDefaultColor(GetColor(8));
OverBought.SetDefaultColor(GetColor(8));
UpSignal.SetDefaultColor(Color.UPTICK);
UpSignal.SetPaintingStrategy(PaintingStrategy.ARROW_UP);
DownSignal.SetDefaultColor(Color.DOWNTICK);
DownSignal.SetPaintingStrategy(PaintingStrategy.ARROW_DOWN);

Marked as spam
Posted by (Questions: 1, Answers: 2)
Asked on April 15, 2020 6:40 am
536 views
0
Hmmm The RSI for some reason is still coming up with ones where it is not under 30/ oversold.. I did try this to be oversold also. Maybe I have a setting in Think or Swim that is incorrect.
( at April 15, 2020 7:28 am)
0
Private answer

The screenshot from my original answer contained an error for the RSI portion. However If you watch the video on the Condition Wizard and build one from scratch you should have discovered the error. So please take the time to watch the video from start to finish so you understand how to construct these on your own.

Screenshot below contains the correction.

Attachments:
Marked as spam
Posted by (Questions: 37, Answers: 4087)
Answered on April 15, 2020 11:19 am
0
What you put for RSI why would it still bring up things that are over 30. Is the scanner bringing up what had happened through the whole day. I see that you have 1 bar so I would think that it would be what just happened not 15min or 20min or 2 hrs ago.
( at April 15, 2020 11:36 am)
0
The scan will not bring up anything with RSI above 30. If you find results using this scan where current live candle has RSI above 30 then you absolutely have an issue with your chart settings not being the same as what is used for the scans.
( at April 15, 2020 11:47 am)
0
So using what you gave me the scan should show me what is coming up on the chart with a green arrow. Cause I am not seeing it. So I will call TDamritrade to see if something is wrong. I only 16 stocks come up.
( at April 15, 2020 11:59 am)
0
Well TDameritrade was useless I showed them and they had no clue....
( at April 15, 2020 12:31 pm)
0
The green arrow on the RSI only appears when RSI crosses back above the 30 line. So yes, you are correct in that no scan results would show a green arrow on the RSI lower study if you have the signals turned on. If you want to scan for those green arrows you have to scan for RSI crossing above 30. Not below 30. Perhaps this helps you understand the results. The results are correct, your expectations are not?
( at April 15, 2020 1:34 pm)