Scan for stocks right below previous daily close


Category:
0
0

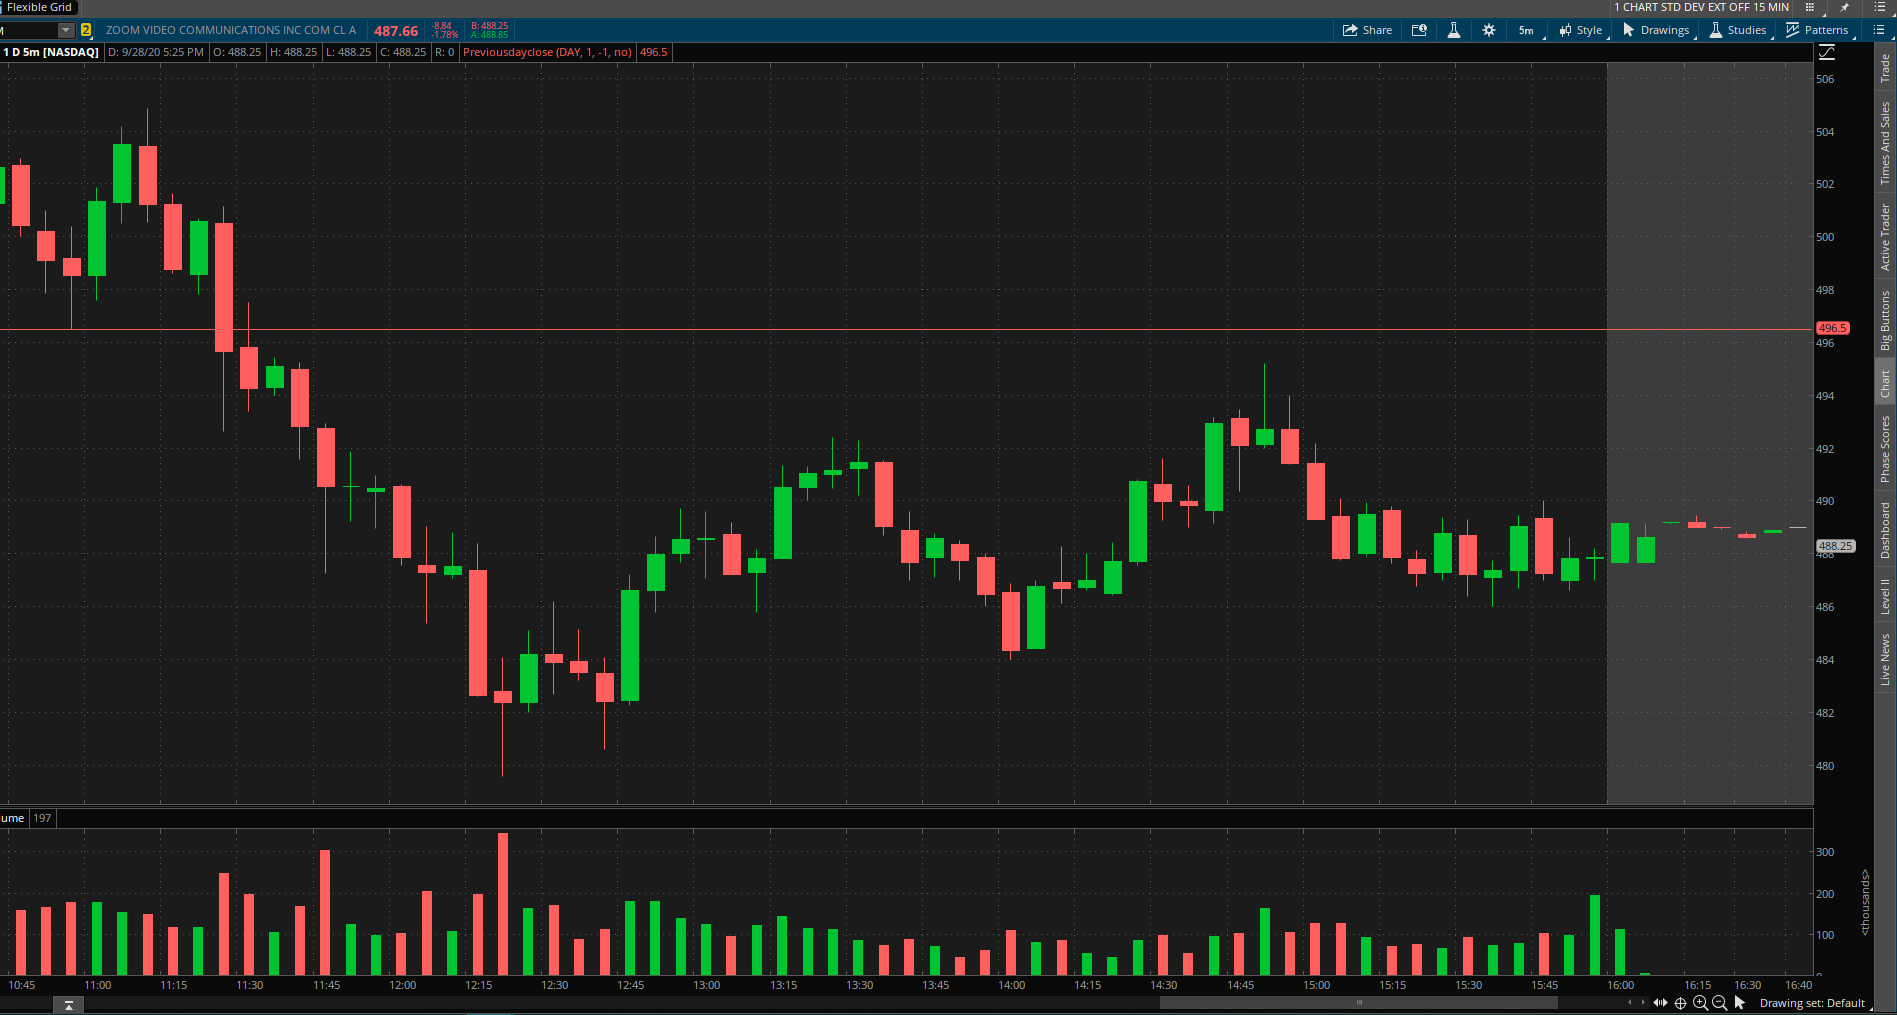
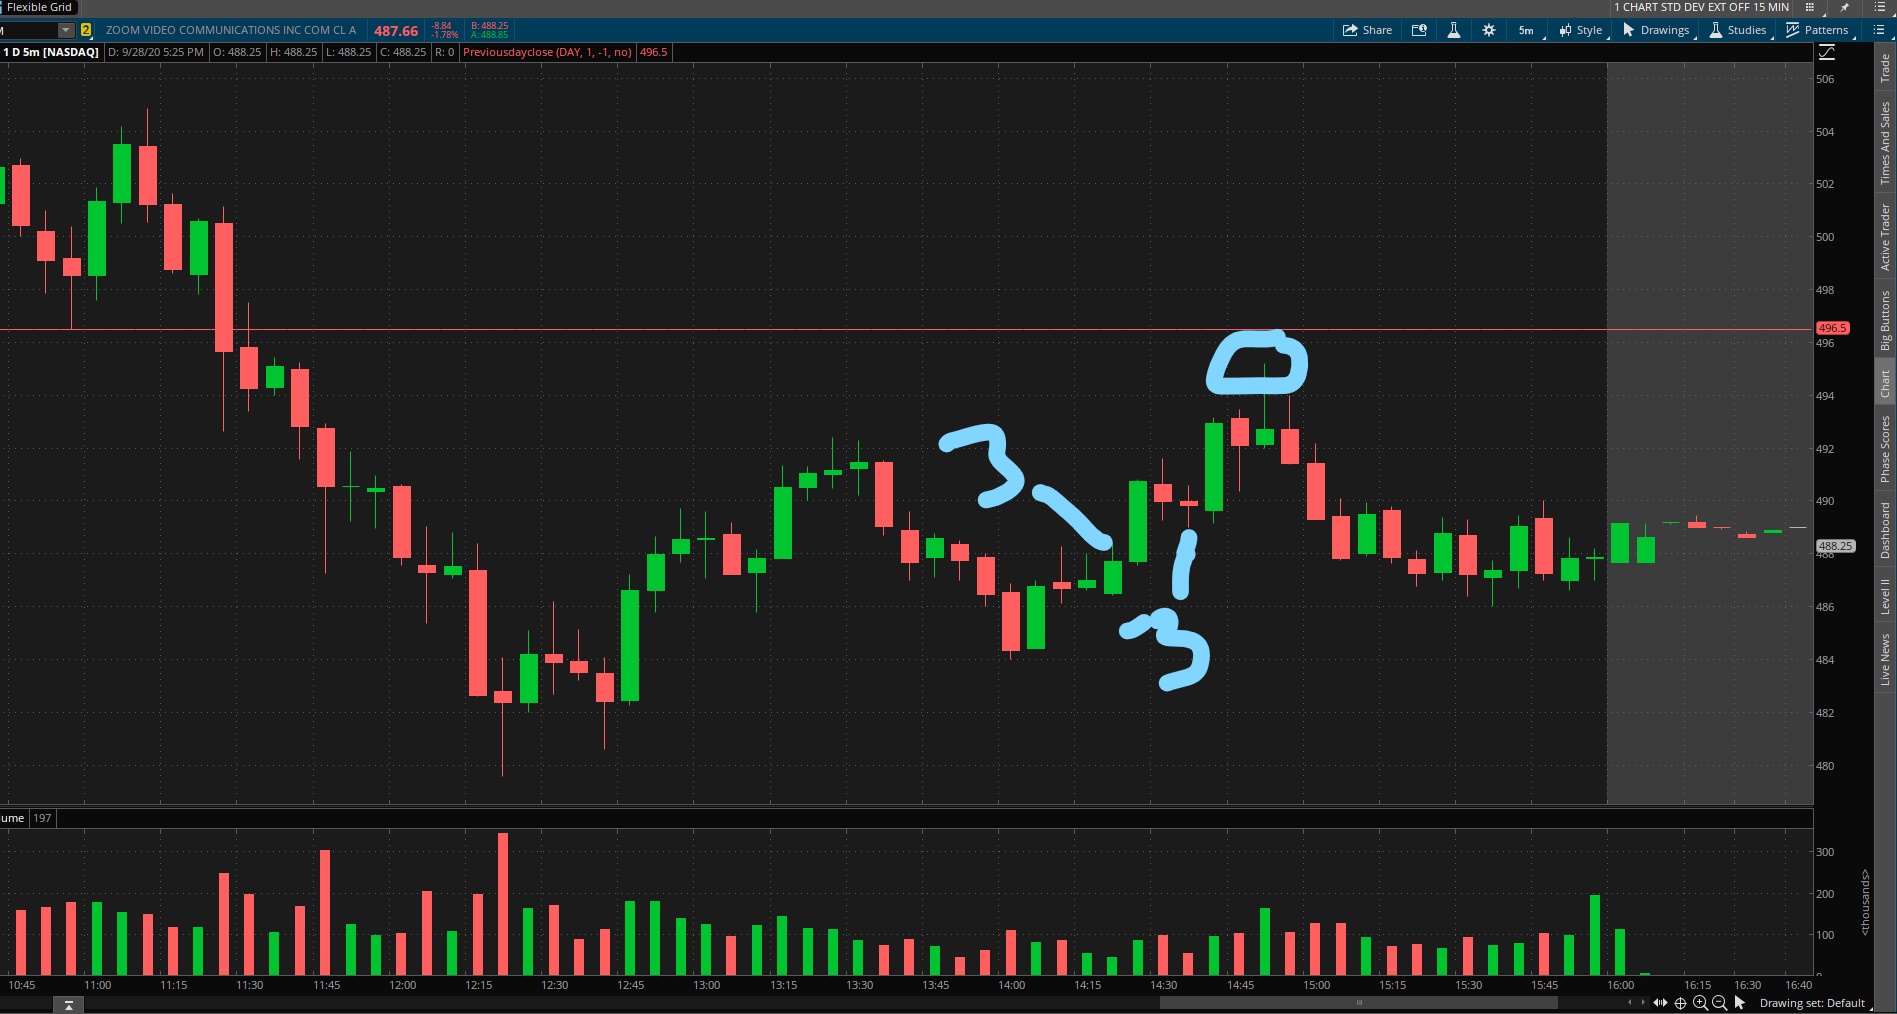
On the chart, the red line is the previous daily close for zm 5min 1 day chart. I am wanting to scan for stocks right before crossing the previous daily close that have been trending in that direction ( up or down) on a 5 minute  1 day chart. I would rather have the scan show right before the crossover (ex 10c before) so that I can be prepared to buy as the crossover happens. To make sure the stock has been trending toward the direction of the previous daily close(instead of just bouncing up and down around the previous daily close), i thought the stock’s 5 min bar close would be higher than 3- 5min bars ago (this would be trending upward toward the previous daily close) and then that 5 min bar would be higher than 3- 5 min bars previously . ( drawn as best as possible on chart with a 3 near each 5 min bar) Separating the 3 bars and 3 bars instead of just doing higher than 6 – 5min bars is an attempt to have a trend on the chart. Really appreciate all your help, and the work you do on your site is very inciteful .

Attachments:
Marked as spam
Posted by (Questions: 1, Answers: 0)
Asked on September 28, 2020 2:54 pm
130 views
0
Private answer

Fixed values such as 10 cents is very poor form for designing tools for trading. That fixed value will be utterly useless for stocks that trade 5 bucks a share and for stocks that trade 1,000 bucks a share. So I converted your fixed value to a percent of close. This enables to code to automatally adapt to various priced stocks. An even better approach would be to compute the average true range and take a percent of the average true range. That would adapt to various priced stocks but also would adapt to changing volatility. However I do not have time to fully implement that.

This is what I had time to complete. Very important that you uncheck the box for extended hours session as this code will not work unless extended hours data is turned off.

input trendingBars = 6;
input percentThreshold = 0.02;
def newDay = GetDay() <> GetDay()[1];
rec dailyClose = if newDay then close[1] else dailyClose[1];
plot scan = close > Highest(close[1], trendingBars) and close > dailyClose * (1 - percentThreshold * 0.01) and close < dailyClose;

Please note that for the example chart you provided, the bar on the chart that you circled did not even come close to being within 10 cents of the previous daily close. I also did not have time to include you request for a double test for the trend. I had to combine all 6 bars into one test for trend.

Marked as spam
Posted by (Questions: 37, Answers: 4084)
Answered on September 28, 2020 4:57 pm