| ♥ 0 |
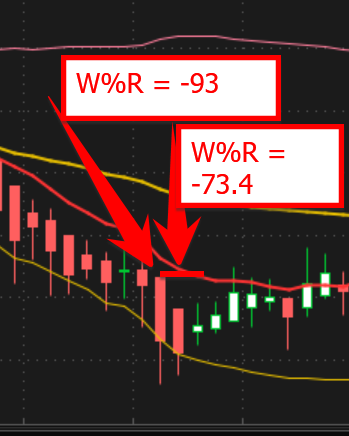
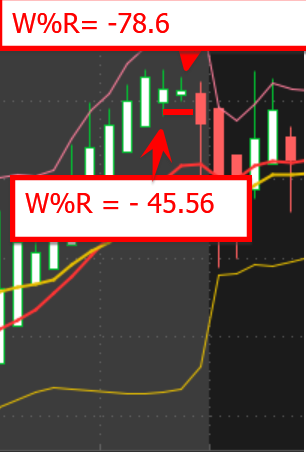
Hi Pete, I did as you instructed me, went to the drawing board. This is what I think will help me. Heiken Ashi candles Williams % R indicator, AccumDistPrVol indicator FIRST: IF Candle 1 top is higher than Candle 2 top, AND Candle 1 W%R is smaller than Candle 2 W%R( negative number) that is a signal to be checked. SECOND: IF Candle 1 BOTTOM is lower than Candle 2 bottom, AND Candle 1 W%R is bigger than Candle 2 W%R( negative number) that is a signal to be checked.
Attachments:
Marked as spam
Asked on April 14, 2020 4:12 am
341 views
|
|
Private answer
If not for the Heiken-Ashi candles we could build this using the Condition Wizard. The first step is to build the Heiken-Ashi candles for the scan. For that I will simply steal some code from a previous solution: https://www.hahn-tech.com/ans/two-consecutive-green-heikin-ashi-candles/ Then we combine the first several lines from that solution with the code from Thinkorswim for the WilliamsPercentR. Last few lines contain your scan signals:
Marked as spam
Answered on April 14, 2020 7:17 am
|