While the original author of the question failed to provide any details about which of the signals they wanted to use for the scan we do have another viewer expressing an interest. In the comments section above you can see the other viewer has requested how to construct a scan from the "Buy Formation" and from the "Buy Array".
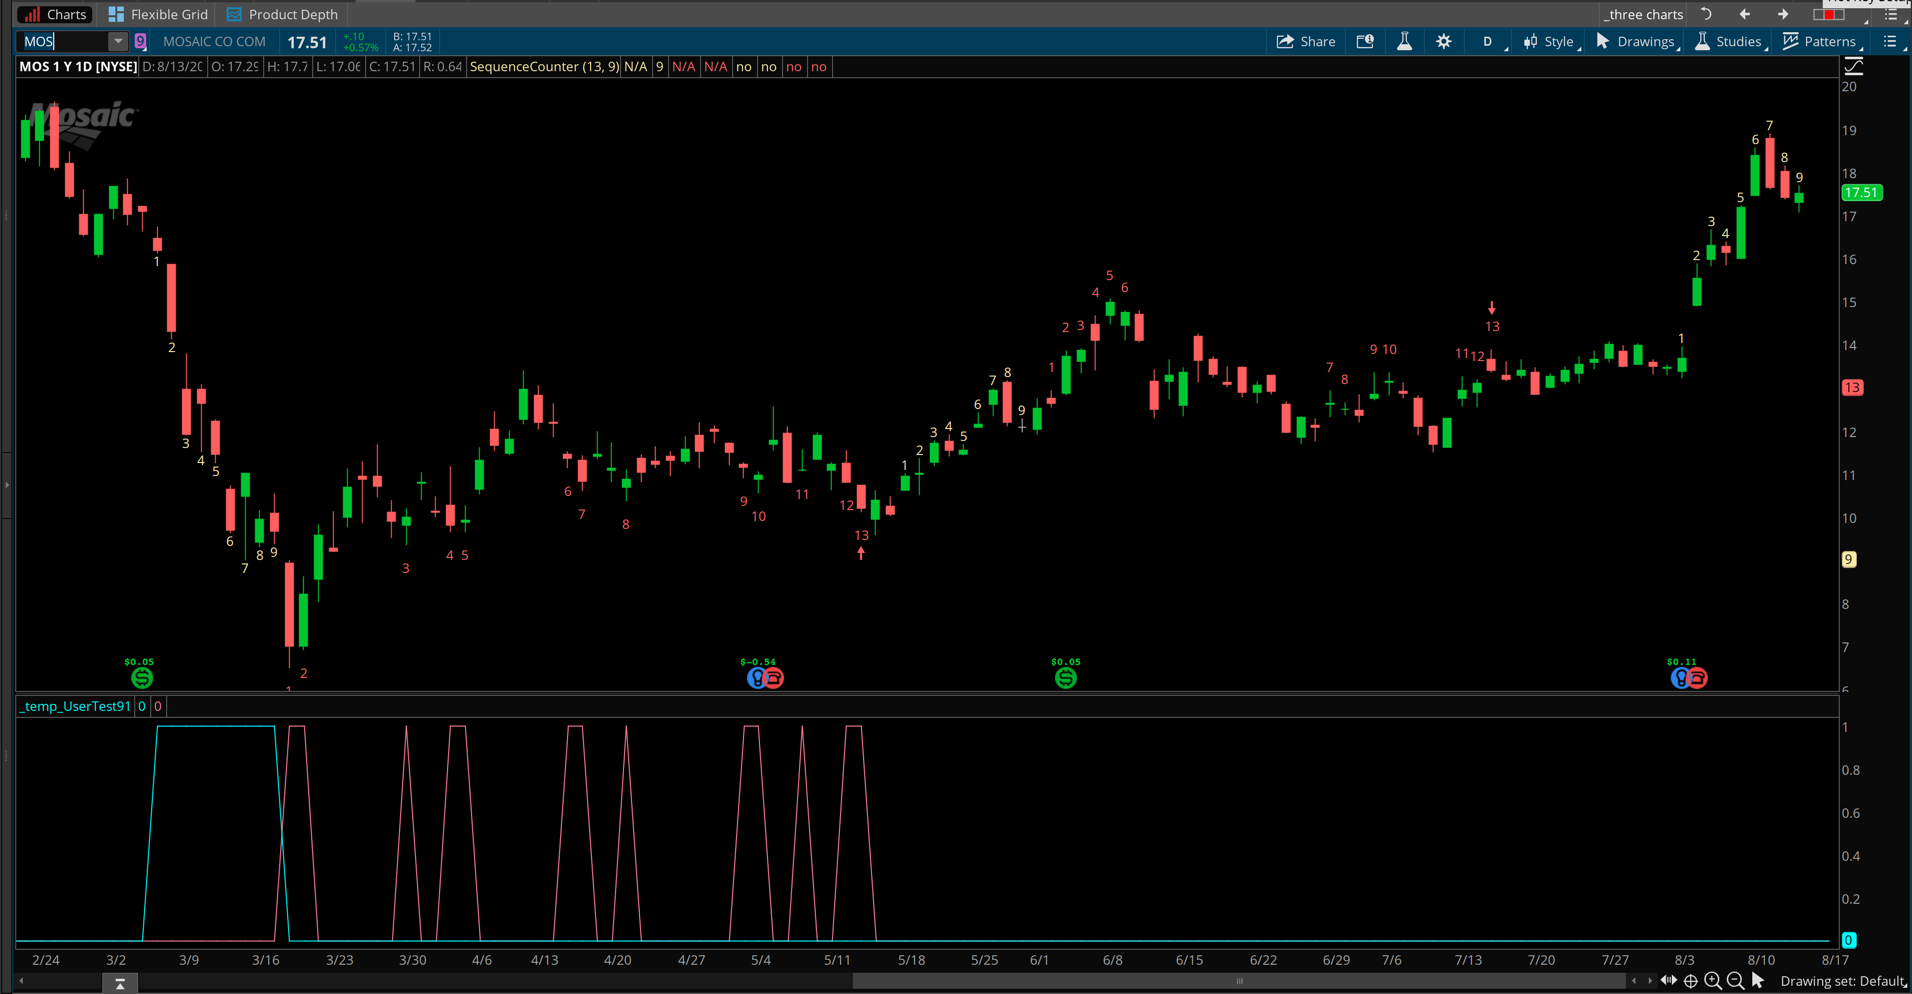
Let's convert these to true/false conditions and see what they look like on the chart. The code below can be used to create a new chart study. It will plot the true/false conditions that the scan would use to pick up these signals. In the lower study you will find the spikes in the blue and red lines correspond with the values displayed for the two plots listed in the paragraph above.
declare lower;

def testOne = SequenceCounter()."Buy Formation";

def testTwo = SequenceCounter()."Buy Array";

plot dataOne = !IsNaN(testOne);

plot dataTwo = !IsNaN(testTwo);
I have included a screenshot below to show what this looks like on the chart.
You can see that it's not as simple as requesting a scan for "Buy Formation" or "Buy Array". Those are not signals, the indicator actually plots values. So do you want the scan to pick up anytime there is a number printed at the bottom of a candle? Or does the value of the number have some significance so that you require the code to look for a specific value?
Having seen this for myself, I can't imagine anyone asking for a scan for this indicator without explaining what values matter to them. However if all you need is any value at all then the scan looks like this:
def buySequence = SequenceCounter()."Buy Formation";

plot scan = !IsNaN(buySequence);
And yes, a scan can only have one plot statement. If you did not know this about custom scans you can watch any one of our several free tutorials on custom scans to learn that. If this is new information to you I suggest you spend some time viewing our scan tutorials before requesting a custom scan of your own.
There are 8 separate plots for this chart study. Which ones are you trying to use to build your scans? You only mentioned Buy and Sell. However there are no plots by those names in this chart study. Here are the available plots:
plot "Buy Formation" = Double.NaN;
plot "Sell Formation" = Double.NaN;
plot "Buy Array" = Double.NaN;
plot "Sell Array" = Double.NaN;
plot "Perfect Buy" = Double.NaN;
plot "Perfect Sell" = Double.NaN;
plot "Perfect Array Buy" = Double.NaN;
plot "Perfect Array Sell" = Double.NaN;
Please clearly explain which ones you want to use for your scan signals.