Hi Pete,
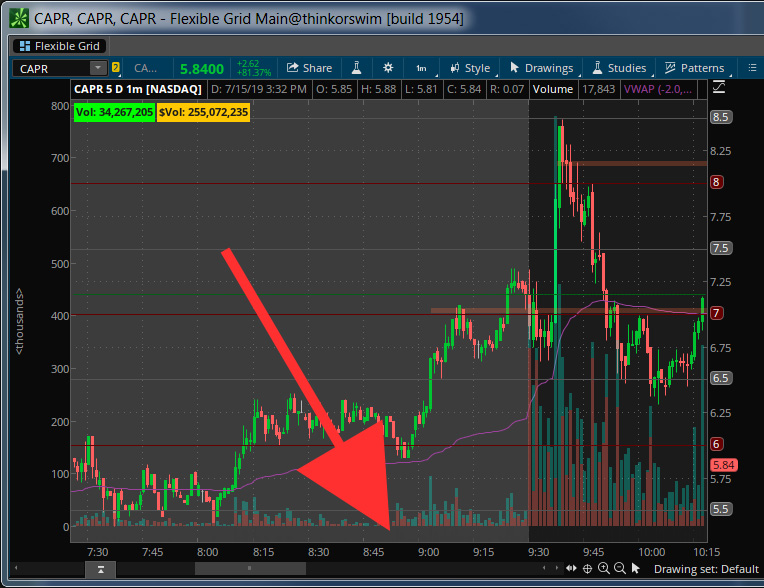
I figure if anyone can solve this one, it is you. I’ve had this nagging issue with a volume bars study that I use to overlap onto my charts. As you can see in the attached image, the price axis is shifted on the chart, so 0 is not at the bottom (thus showing a gap there). This only happens when I overlap this study onto the chart. Note also, the the built-in volume study does not have this issue. Is there anything that can be done to fix this so 0 is at the bottom of the chart?
Thanks Pete!
declare lower;
def O = open;
def H = high;
def C = close;
def L = low;
def V = volume;
def Buying = V*(C-L)/(H-L);
def Selling = V*(H-C)/(H-L);
# Selling Volume
Plot SV = selling;
SV.setPaintingStrategy(PaintingStrategy.Histogram);
SV.SetDefaultColor(Color.DARK_RED);
SV.HideTitle();
SV.HideBubble();
SV.SetLineWeight(5);
# Buying Volume
# Plot BV = Buying;
# Note that Selling + Buying Volume = Volume.
Plot BV = volume;
BV.setPaintingStrategy(PaintingStrategy.Histogram);
BV.SetDefaultColor(Color.Cyan);
BV.HideTitle();
BV.HideBubble();
BV.SetLineWeight(5);