Show Gain/Loss Percentage


Category:
0
0

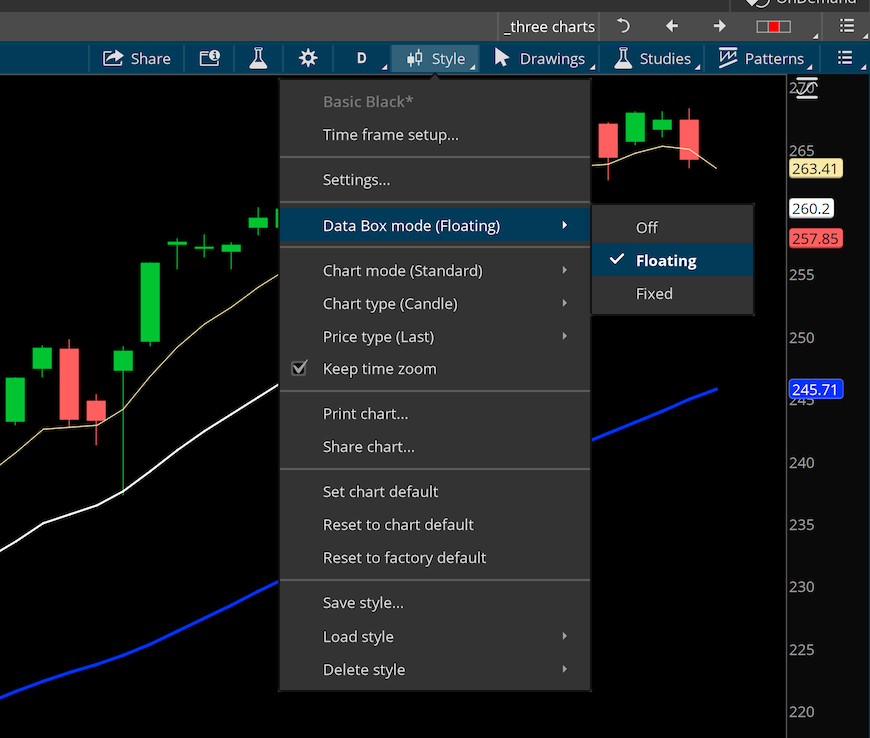
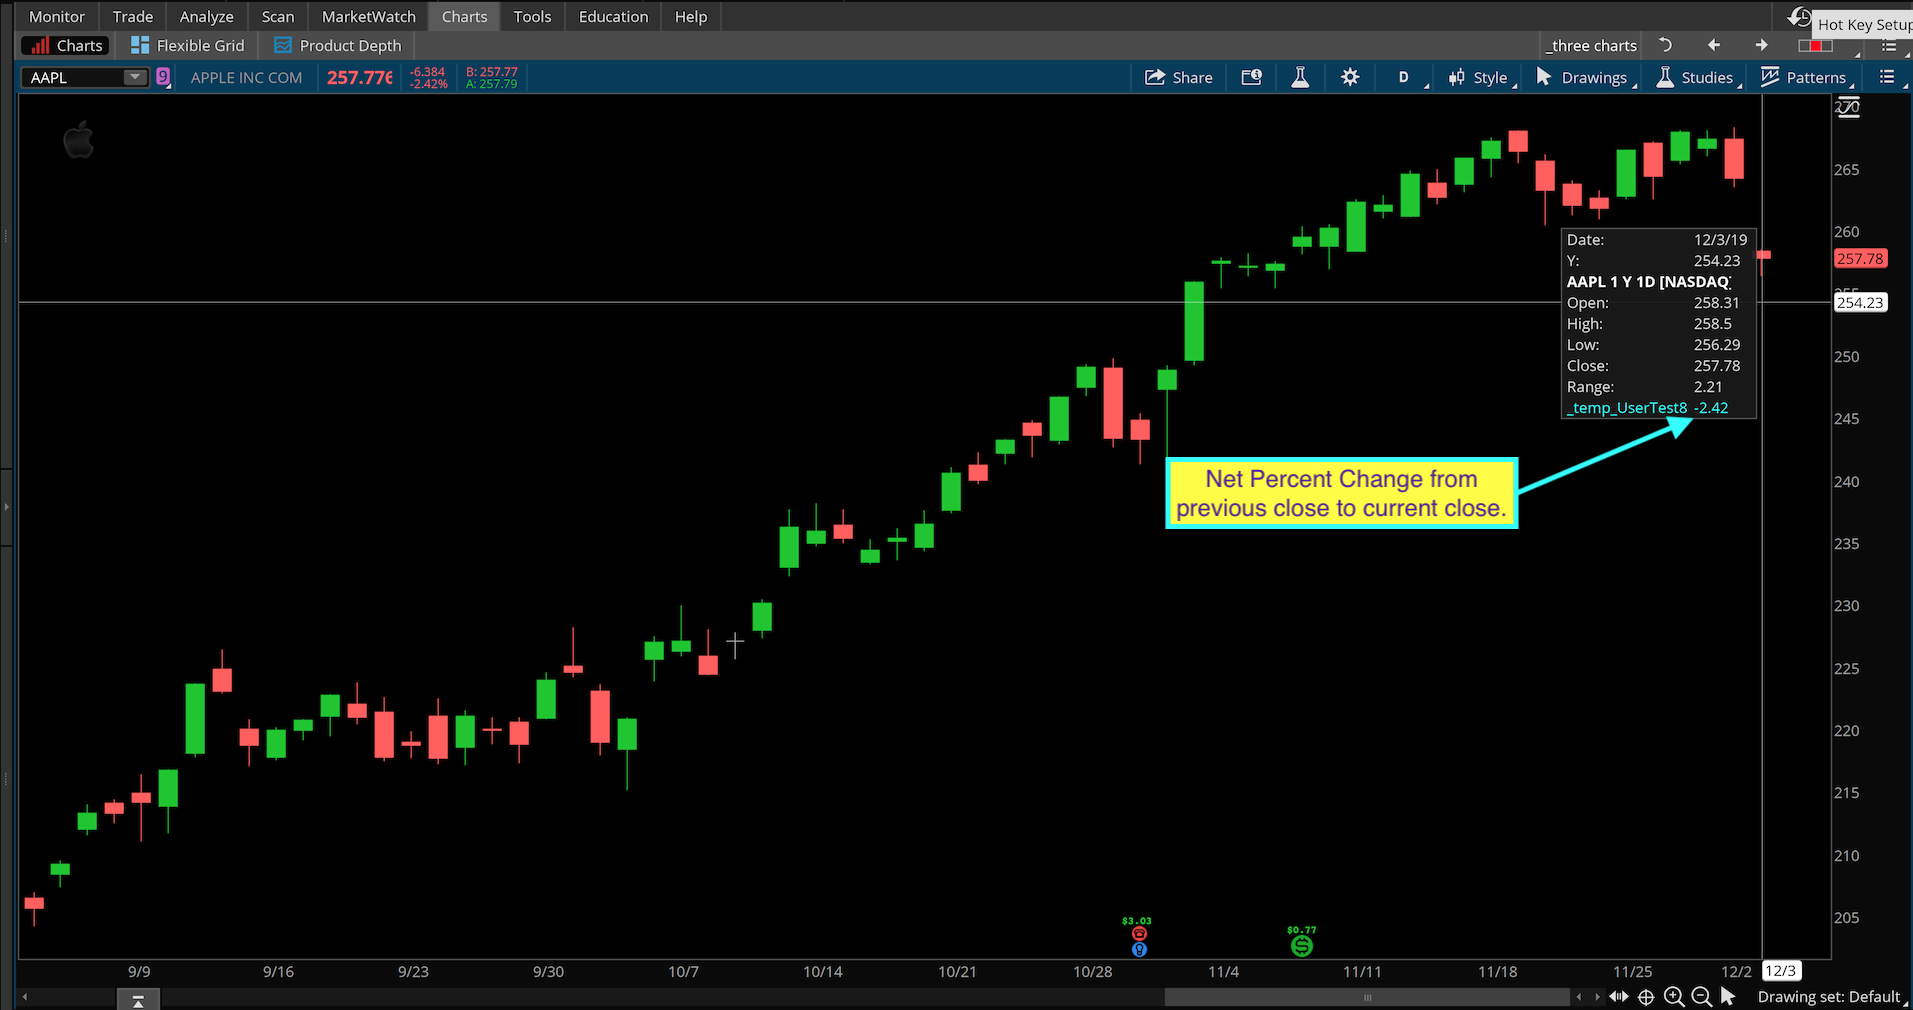
Hi Pete,

I hope you had a great Thanksgiving. I’m very happy to see that your final Go Fund Me update had a happy ending. Hopefully, you saw my donation. Now to my question. How to add a chart bubble showing the gain/loss in percentage from the previous bar close when the cursor is on any given bar? Trading View shows this in all time frames but I don’t see it in TOS?

Thanks again!

Marked as spam
Posted by (Questions: 20, Answers: 27)
Asked on December 3, 2019 9:09 am
94 views
0
Private answer

Thanks Tuan, I hope you and your family had a happy Thanksgiving Holiday as well. Thank you very much for your generous donation to my medical expenses.

The only way to achieve something similar in Thinkorswim requires two steps.

  1. Set your chart setting "Data Box mode" to Floating
  2. Create a new chart study which contains the following line of code
    1. plot percentChange = 100 * (close / close[1] - 1);

First screenshot below shows where to find the Data Box mode setting. The second screenshot below shows how it appears when hovering over a specific candle after adding the custom chart study with that line of code from point 2.1 above.

The only drawback to this method is the chart setting for Data Box mode is global. Which means it applies to every chart you have open on the platform or any new charts you open.

Attachments:
Marked as spam
Posted by (Questions: 37, Answers: 4087)
Answered on December 3, 2019 10:49 am
0
I guess I don't like this style as I thought initially. How to add a label instead to show the percent change?
( at December 3, 2019 1:13 pm)
0
No, this is the only option. There is no other way to accomplish this in Thinkorswim. A chart label can only read the last bar on the chart. There is nothing in the Thinkorswim language that permits us to directly interact with the user input device, such as the position of the mouse hover over a bar on the chart.
( at December 3, 2019 4:19 pm)