Show gaps with percent change


Category:
0
0

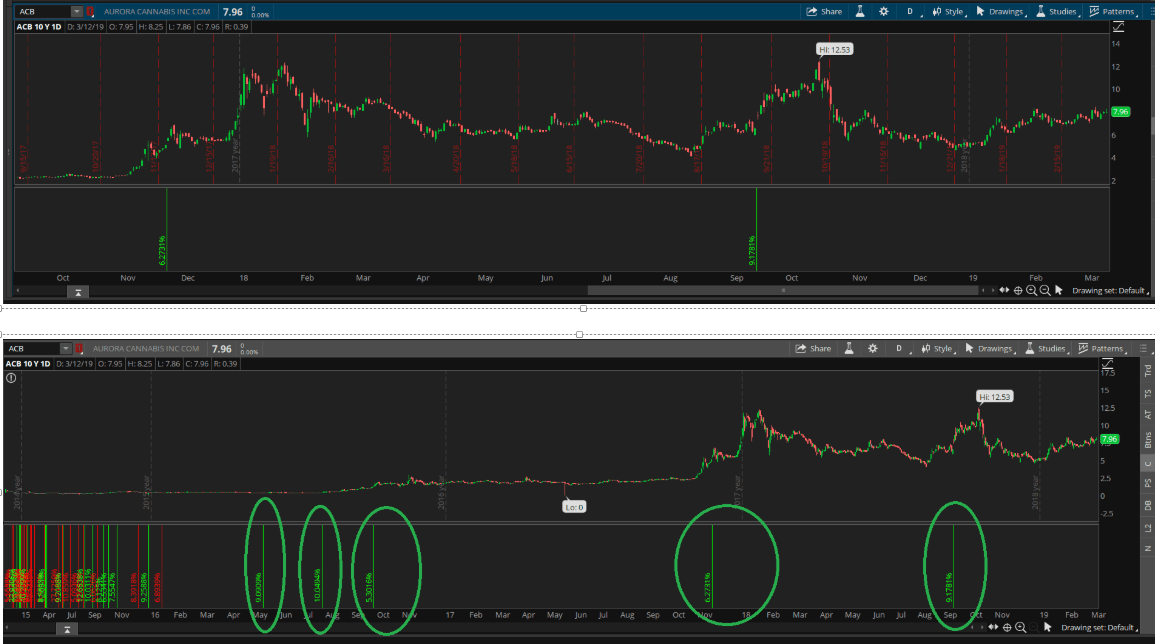
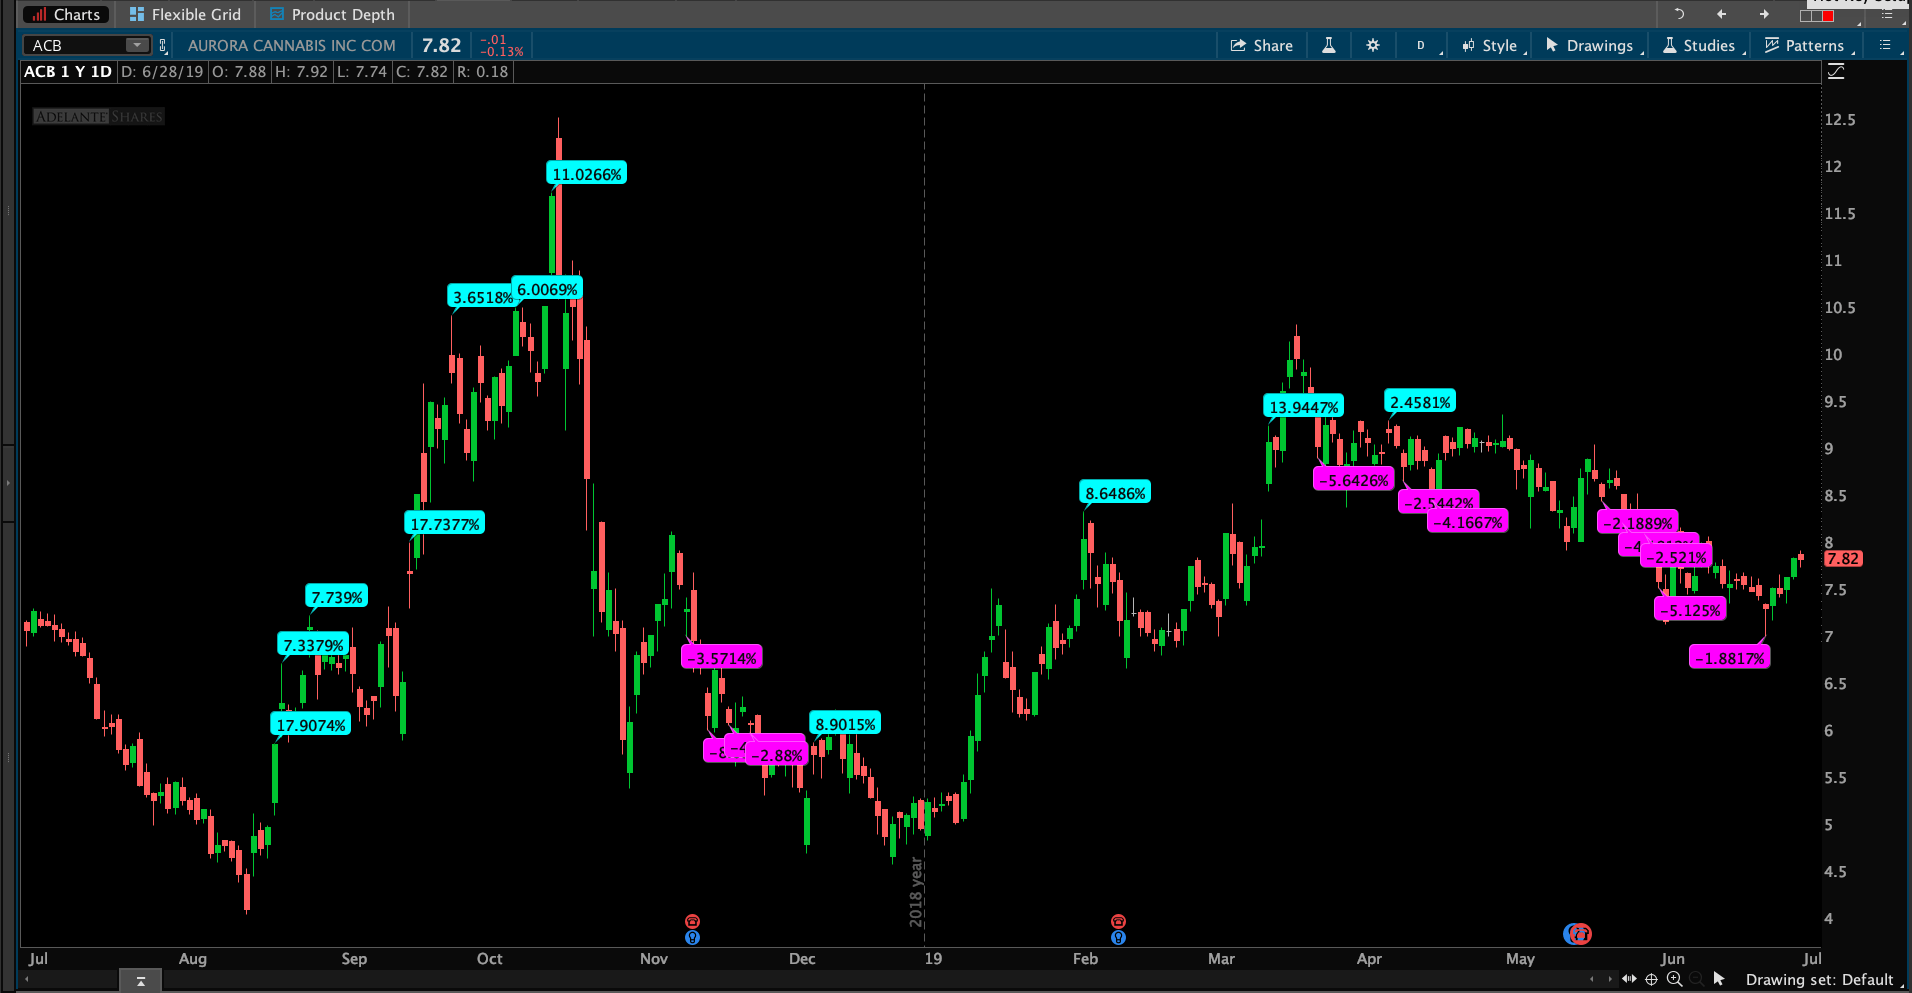
Hi there, wanted to see if someone would be able to create a study that will mark when gaps occur.  If it gapped up, then it would be green, gap down would be red.  and show the percentage of how much it gapped.  Also would be nice to be able to adjust the percentage of gap to display (ex: only display gaps > 10% on daily chart).

Attachments:
Marked as spam
Posted by (Questions: 2, Answers: 2)
Asked on June 28, 2019 7:27 am
153 views
0
Private answer

I updated the title of your question to make it easier for other viewers to search for and find this solution. Here is the code. Screenshot below shows the results.

def gapUp = low > high[1];
def gapDown = high < low[1];
AddChartBubble(gapUp, high, (100 * (close / close[1] -1) + "%"), Color.CYAN, yes);
AddChartBubble(gapDown, low, (100 * (close / close[1] - 1)) + "%", Color.MAGENTA, no);

Attachments:
Marked as spam
Posted by (Questions: 37, Answers: 4087)
Answered on June 29, 2019 10:39 am
0
Thanks… I added vertical lines based off of your code. I greatly appreciate your assistance! def gapUp = low > high[1]; def gapDown = high < low[1]; AddVerticalLine(gapUp, (100 * (close / close[1] -1) + "%"), Color.GREEN,Curve.FIRM); AddVerticalLine(gapDown, (100 * (close / close[1] - 1)) + "%", Color.RED,Curve.FIRM);
( at June 30, 2019 7:02 am)