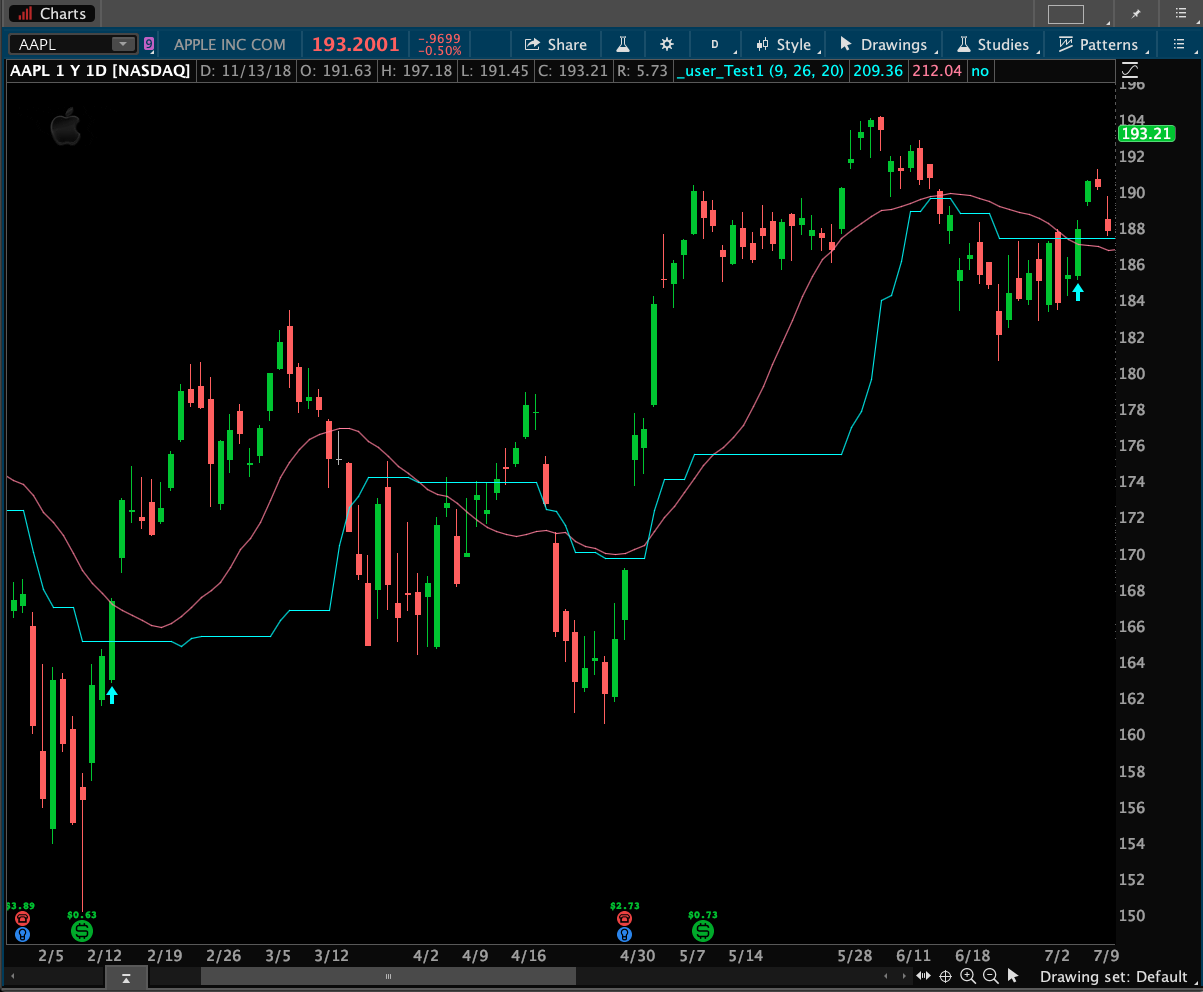
Since you posted this in the Chart Studies topic I will provide the solution in the form of a chart study. Here is the code, as well as a screenshot showing what it looks like.
input tenkan_period = 9;

input kijun_period = 26;

input smaLength = 20;

def Tenkan = (Highest(high, tenkan_period) + Lowest(low, tenkan_period)) / 2;

plot Kijun = (Highest(high, kijun_period) + Lowest(low, kijun_period)) / 2;

plot sma = Average(close, smaLength);

def conditionKijun = close[1] < Kijun[1] and  open < Kijun and close > Kijun;

def conditionSMA = close[1] < sma[1] and open < sma and close > sma;

plot signal = conditionKijun and conditionSMA;

signal.SetPaintingStrategy(PaintingStrategy.BOOLEAN_ARROW_UP);

signal.SetDefaultColor(Color.CYAN);

signal.SetLineWeight(3);
I entered the codes and it’s giving me this message at the bottom: Exactly one plot expected.
As I mentioned, this question was posted in the Chart Studies topic. So a chart study is what I have provided. If you are getting a message that only plot is expected that can only be because you are trying to apply it as a scan.
Ohh, so I need to post it in the Stock Scanners topic. Let me do that. Sorry about that.
You don’t need to post this again. No sense duplicating it. I can show you the scan version here.
input tenkan_period = 9;
input kijun_period = 26;
input smaLength = 20;
def Tenkan = (Highest(high, tenkan_period) + Lowest(low, tenkan_period)) / 2;
def Kijun = (Highest(high, kijun_period) + Lowest(low, kijun_period)) / 2;
def sma = Average(close, smaLength);
def conditionKijun = close[1] < Kijun[1] and open < Kijun and close > Kijun;
def conditionSMA = close[1] < sma[1] and open < sma and close > sma;
plot signal = conditionKijun and conditionSMA;
That is a version that will work as a scan. Seems you could benefit from watching our videos that cover the scan topic. https://www.hahn-tech.com/category/tos/scans-tos/
This is pretty simple to convert and just watching a half dozen videos would surely show you how this is done.
Thanks Pete. Will definitely watch the videos in the link you provided ?
Hi Pete, I have been wondering can one same code for a Candle cross 2 different SMA’s to create a signal arrow? Instead of Candle Crossing SMA and Kijun.
Yes it can be done. But you will need to post this as a new request so we don’t muddy up the context of this post.
Sure thing. Thanks.