Slope


Category:
0
0

Is it possible to scan for a 20 degree slope on the 28 EMA? Thanks!

Marked as spam
Posted by (Questions: 34, Answers: 56)
Asked on February 18, 2017 7:27 am
3590 views
0

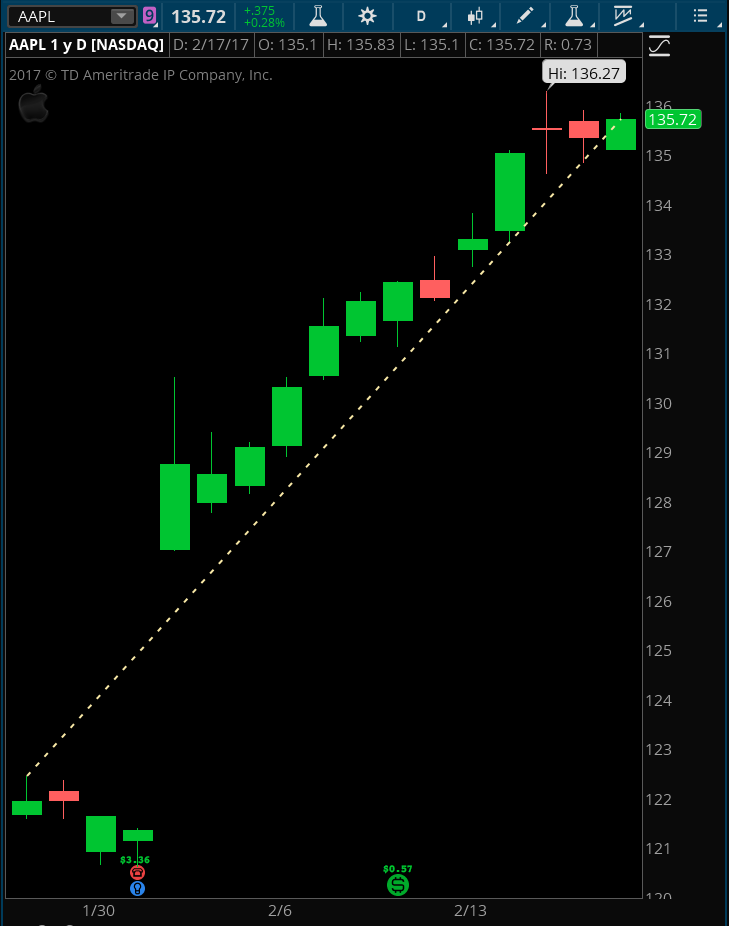
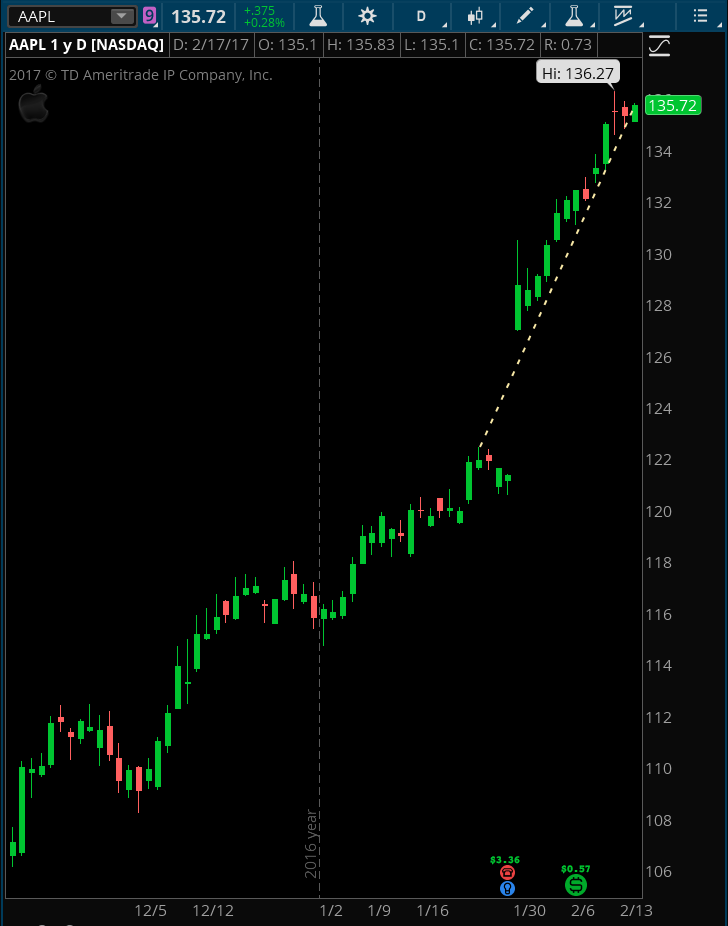
in order to measure the slope, two axis are required. Which means slope is measured as change in price over time. So we need need to know the number of bars over which we should measure the change in value of the 28 EMA.

( at February 18, 2017 9:16 am)
0

I would like to scan for stocks that have a slope of 20 degrees or greater over a period of 9 days on the 28 EMA.

( at February 18, 2017 10:20 am)
0
Private answer

After doing a bit of research I have come to conclude we need another way to define your “slope”. Measuring it’s angle, in degrees is not going to work. I have added a couple of screenshots here to demonstrate. I have drawn a trend line on the chart. Depending on density of either the time or price range (zoom), the line can be steep or shallow. The degrees of the angle in the trend line changes.

My math skills tap out at Algebra. But I am very good at converting math into code, even higher math levels. So if anyone has a formula to offer up I will be happy to write the scan.

Attachments:
Marked as spam
Posted by (Questions: 37, Answers: 4087)
Answered on February 18, 2017 12:44 pm
0
Private answer

I found this site, https://tickertape.tdameritrade.com/thinkmoney/2015/01/cool-scripts-create-moving-average-thinkscript-stock-momentum-tool-23238 . It looks like we have to find the rise over run… Take a look at lines 5-8.

Marked as spam
Posted by (Questions: 34, Answers: 56)
Answered on February 18, 2017 12:49 pm
0

After doing the math, the rise over run would have to be 7/20 or greater.

( at February 18, 2017 12:54 pm)
0
Private answer

Pretty much, it works life this… The slope will be measured off of hourly chart each day. The run will always be 7 (because there are 7 hours in a trading day, 7 EMA plots as seen on the chart below). The run would be the difference between the first plot of the day {extended hours should be ignored} and the last hour of the day {extended hours should be ignored.} Now we have the math for the slope. The slope will always be the same with this concept, it will just appear differently when you look at it from different time frames.

Attachments:
Marked as spam
Posted by (Questions: 34, Answers: 56)
Answered on February 18, 2017 1:18 pm
0

Thanks a lot for tracking this stuff down and providing the links and screenshots. Great stuff. Just so I understand, we are moving away from the original request of a 9 day span of the 28 ema. Instead, we have a new request for a 7 hour span of some other ema. Did you say that ema was going to be a 7 period ema? And now you want to add an additional specification so that the measurement is done on an hourly chart, so that only the regular market hours are considered. And I am guessing the only value that is worth anything in this context is the slope of that ema at the close of the previous day. And to project that idea still further I am guessing you want to scan the market at close each day and find stocks that have this slope greater than some value?
Let me know if I have the correct understanding of this request.

( at February 18, 2017 3:52 pm)
0

Yes, the new scan is a 7-hour span of the 28 EMA. The math would be:

Point 2 (last dot for 28 EMA on the hourly chart) – Point 1 (first dot for 28 EMA on the hourly chart)
Divided by
7 (because there are 7 hourly plots of the 28 EMA each day)

I want to scan the market at close each day and find stocks that have a slope greater than .05

( at February 18, 2017 6:26 pm)
0

Ok, thanks for clarifying. That is some pretty advanced code that I would normally charge to complete as part of a custom Thinkscript project I do for clients. I’ll consider this for a few days and decide if I want to post the solution in the Q&A forum.

( at February 19, 2017 9:55 am)
0

Ok, sounds good!

( at February 19, 2017 4:46 pm)