| ♥ 0 |
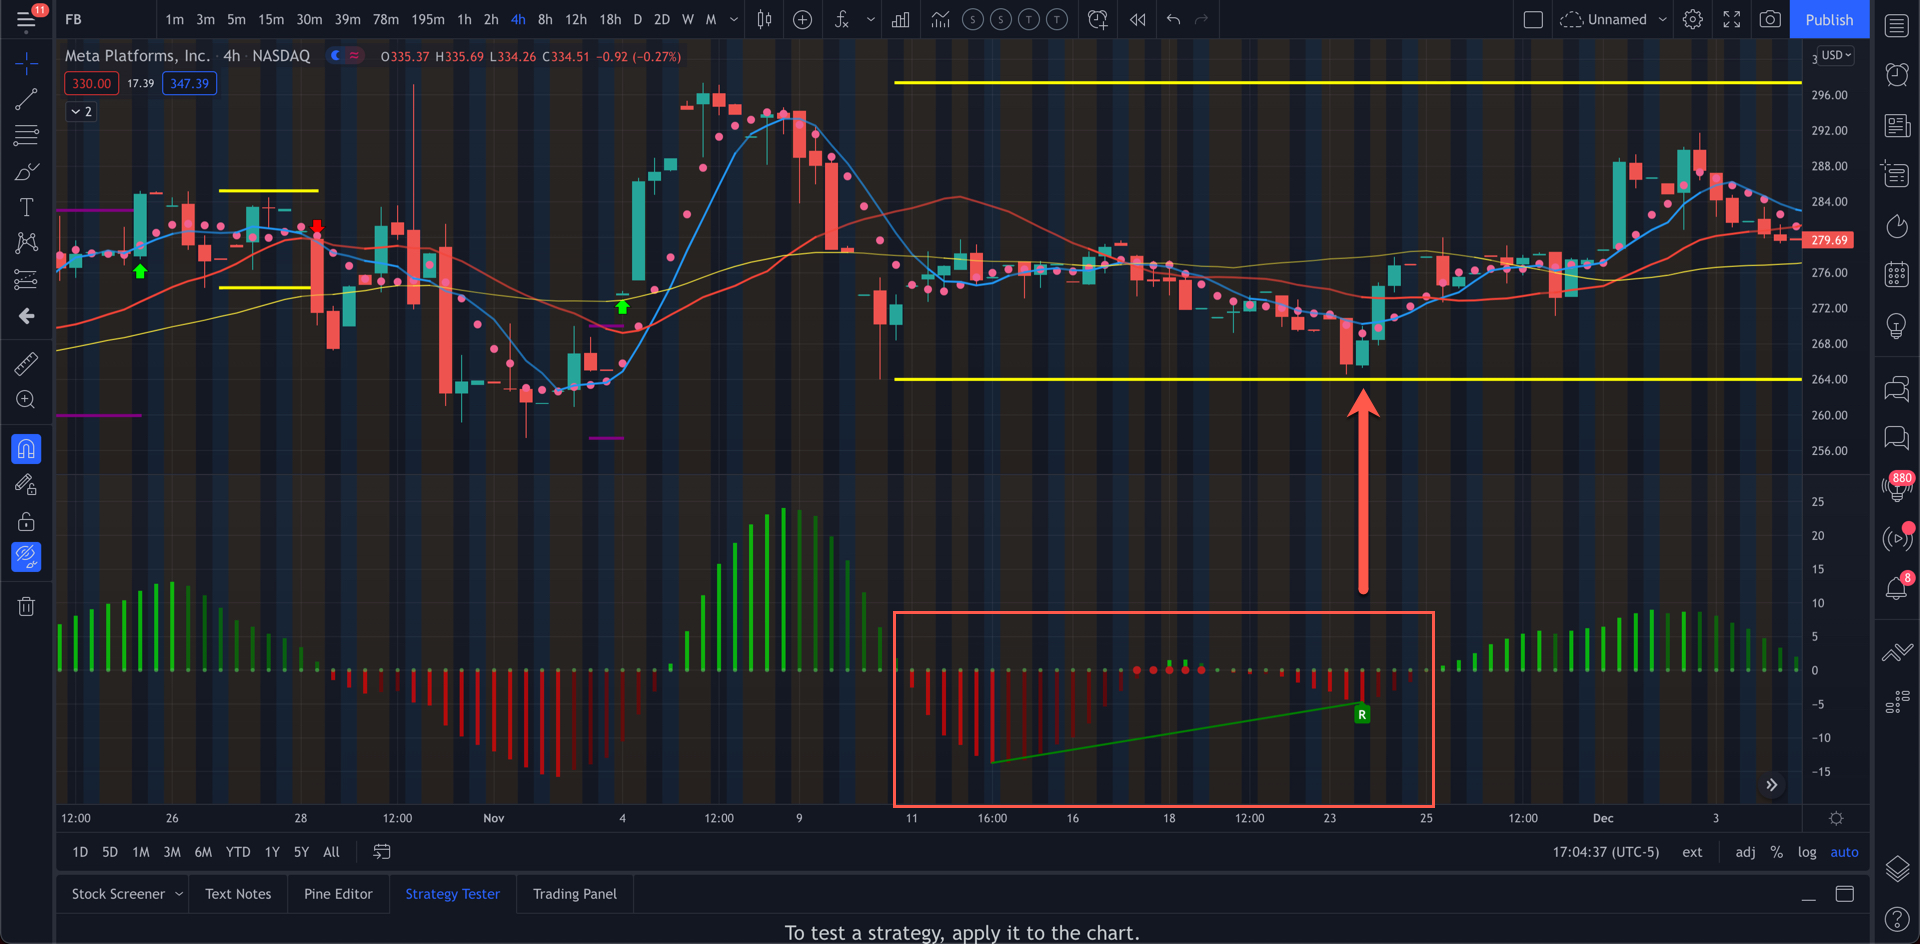
Hi Pete – long time lurker, first time posting for help. I am looking for a way to find (bullish) divergence on the squeeze momentum oscillator. Please see attached photo for reference. The green line identifies that there is bullish momentum divergence with the price (squeeze momentum increasing but price is decreasing). Is there a way to scan for these setups in tos? Attachments:
Marked as spam
Asked on November 9, 2021 3:17 pm
501 views
|
|
Private answer
Yes, this is possible. However the complexity of such a solution is light-years beyond the scope of solutions we can provide free of charge in the Q&A Forum. You will find we have already published premium indicators on this website that display divergence patterns based on RSI, MACD, and Stochastic. (Each one also includes a scan) https://www.hahn-tech.com/premium-chart-indicators/ We have already created several custom versions of these divergence indicators for various clients. (there is an additional fee charged to complete the modifications). So you might consider purchasing one of our premium divergence indicators and then pay us to create a custom version that will include the TTM_Squeeze histogram as one of the two lower studies included with each study. FYI. The only reason we can do this for Thinkorswim is that the TTM_Squeeze is included as a built-in chart study and we can reference the plots from that study without having access to the source code. This would be impossible to do for any other trading platform at this time. Why? Because it would require that we are granted the right to do so by the entity that holds the copyright on that source code. No such permission is required for Thinkorswim because any solution we build from it will NOT expose the source code of the TTM_Squeeze to the public. Marked as spam
Answered on November 9, 2021 3:31 pm
|