| ♥ 0 |
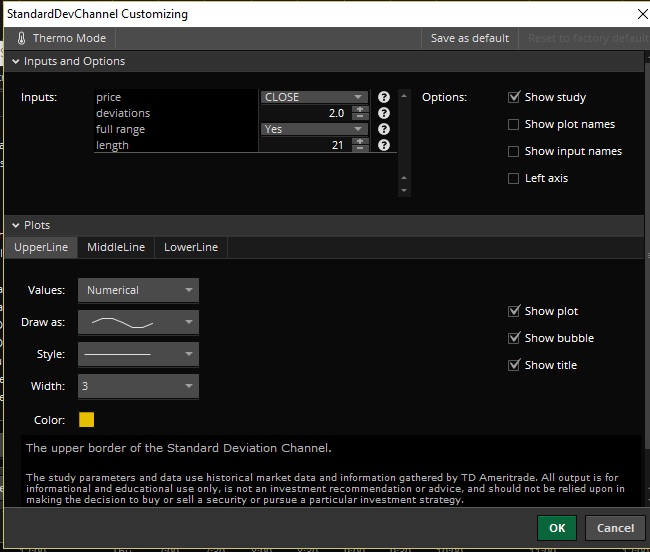
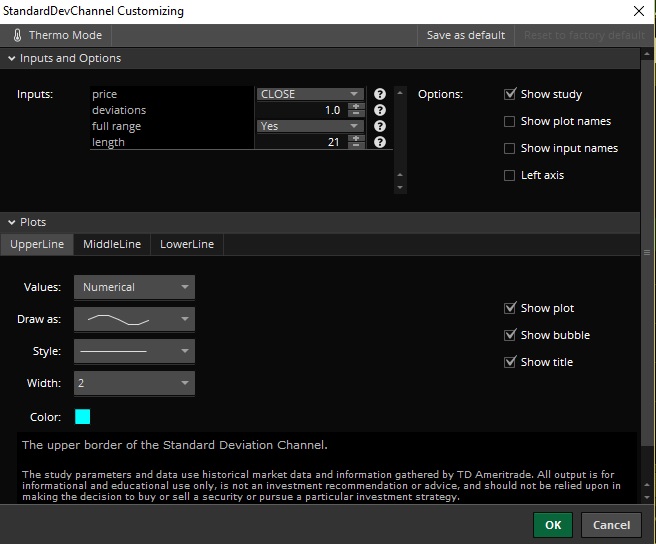
Hi, i’m looking for a scanner that can scan for any stock that hit’s below the standard deviation channel for the daily and the 5 min 30 day chart. Is that possible to do? I’ve been finding them manually but takes forever. Would cut off a lot of time if i had a scanner for it. I have added the deviations that i use. Attachments:
Marked as spam
Asked on May 17, 2018 4:52 pm
1547 views
|
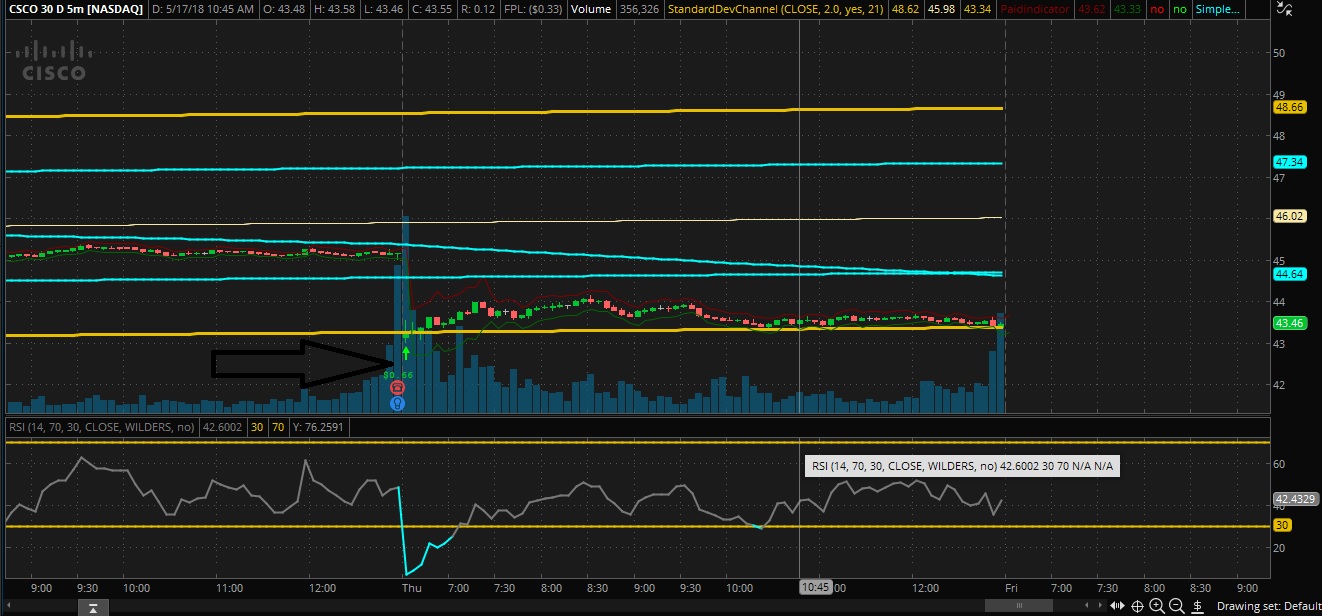
Let me point out the obvious. Because sometimes what is obvious to me is not so obvious to others. On the screenshot you provided. The signal you are asking to pick up is at the beginning of the trading day. However the chart contains the full day’s worth of data. Which means the current position of the deviation channels is NOT what it was at the opening of the market. You will only be able to scan for the signals at the far right side of the chart.
To summarize. Show me a chart with one of these signals occurring at the far right hand side of chart.
The not-so-obvious. Your chart contains 5 days worth of data. The scan engine will contain 15 days of data, including weekends. Since the Standard Deviation channels are computed using all available data, the scan engine is going to have completely different values than what you see on your chart. You can adjust your chart to 10 days worth of data to get closer. But the scan engine will never be able to match your charts exactly.
I would say this request is DOA.