StochasticMomentumIndex cross over while overbought or oversold


Category:
0
0

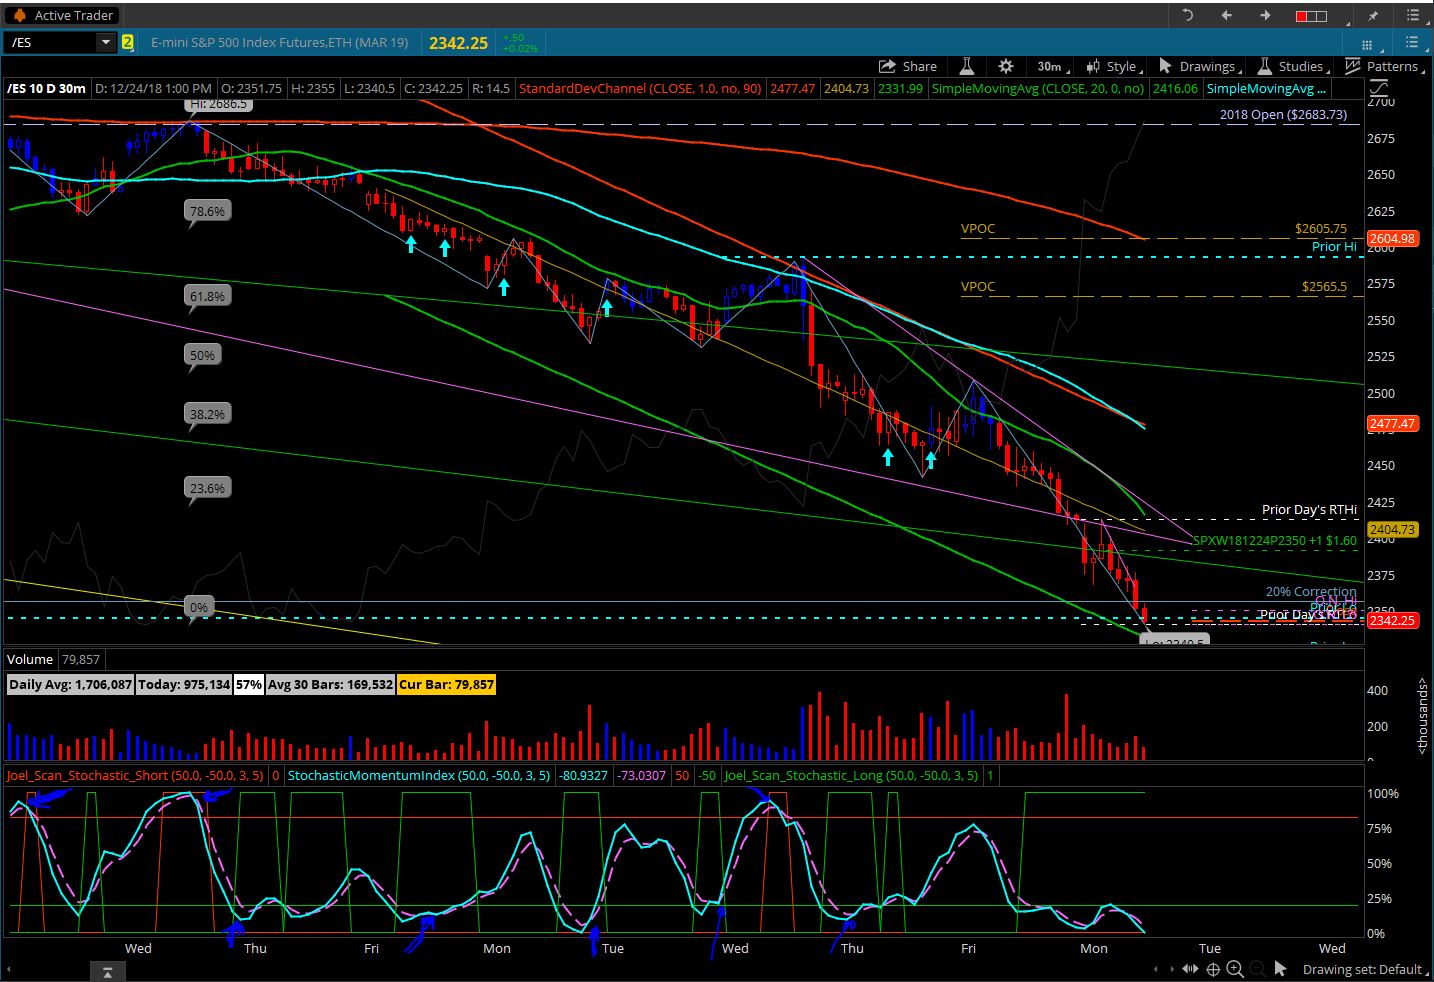
Hello Mr Hahn & Merry Christmas;

I would like your review/guidance related to a Stochastic Momentum Index Scan i’m working on.

The idea is when the SMI (light blue) line crosses the SMIAVG (purple dash line) above and below the value of 50 (this is the value in the code) to produce a signal, red=to go short, green=to go long.

One issue i’ve noticed, is as long as the SMI line are above and below 50, i’m getting wide squared top indication vs the normal pointed carrot type indication.  wondering if you have any recommendation on how to get the indication to point at the crossover point for the downward crossing & upward crossing of the SMIs indicators below the 50 coded level or the red 80% & green 20% lines in the picture.

declare lower;

input over_bought = 50.0;
input over_sold = -50.0;
input percentDLength = 3;
input percentKLength = 5;

def min_low = Lowest(low, percentKLength);
def max_high = Highest(high, percentKLength);
def rel_diff = close – (max_high + min_low) / 2;
def diff = max_high – min_low;

def avgrel = ExpAverage(ExpAverage(rel_diff, percentDLength), percentDLength);
def avgdiff = ExpAverage(ExpAverage(diff, percentDLength), percentDLength);

def SMI = if avgdiff != 0 then avgrel / (avgdiff / 2) * 100 else 0;
#smi.setDefaultColor(getColor(1));

def AvgSMI = ExpAverage(SMI, percentDLength);
#avgsmi.setDefaultColor(getcolor(0));

#Long
plot Data = (SMI[1] < avgrel[1]) and (SMI < avgrel) and (lowest(SMI[1], 2) < -50);

#Short
#plot Data = (SMI[1] > avgrel[1]) and (SMI > avgrel) and (lowest(SMI[1], 2) > 50);

Attachments:
Marked as spam
Posted by (Questions: 1, Answers: 0)
Asked on December 25, 2018 10:22 am
229 views
0
Private answer

I updated the question title to include the actual name of the study used in your code. This also changed the URL so the original link to this post has been broken. I also moved this out of the Strategy Guide topic and into the Chart Studies topic. Your code contains no buy/sell statements and is not a valid Strategy.

You will find the problem in you final plot statements. You are not correctly specifying a crossover. Your code is essentially saying: “SMI of previous bar is less than average of previous bar and SMI of current bar is less than average of current bar.” That is not a crossover. You are merely checking if the SMI has been below the average for the most recent two bars.

Here are your two lines of code as you posted them:

plot Data = (SMI[1] < avgrel[1]) and (SMI < avgrel) and (lowest(SMI[1], 2) < -50); #plot Data = (SMI[1] > avgrel[1]) and (SMI > avgrel) and (lowest(SMI[1], 2) > 50);

Here are the corrected versions. I also cleaned things up a bit as you had numerous parentheses which were not required.

plot Data = SMI[1] < avgrel[1] and SMI > avgrel and lowest(SMI[1], 2) < -50; #plot Data = SMI[1] > avgrel[1] and SMI < avgrel and lowest(SMI[1], 2) > 50;


Marked as spam
Posted by (Questions: 37, Answers: 4087)
Answered on December 26, 2018 7:32 am