T3 Adaptive Smoothing Indicator as Scan


Category:
0
0

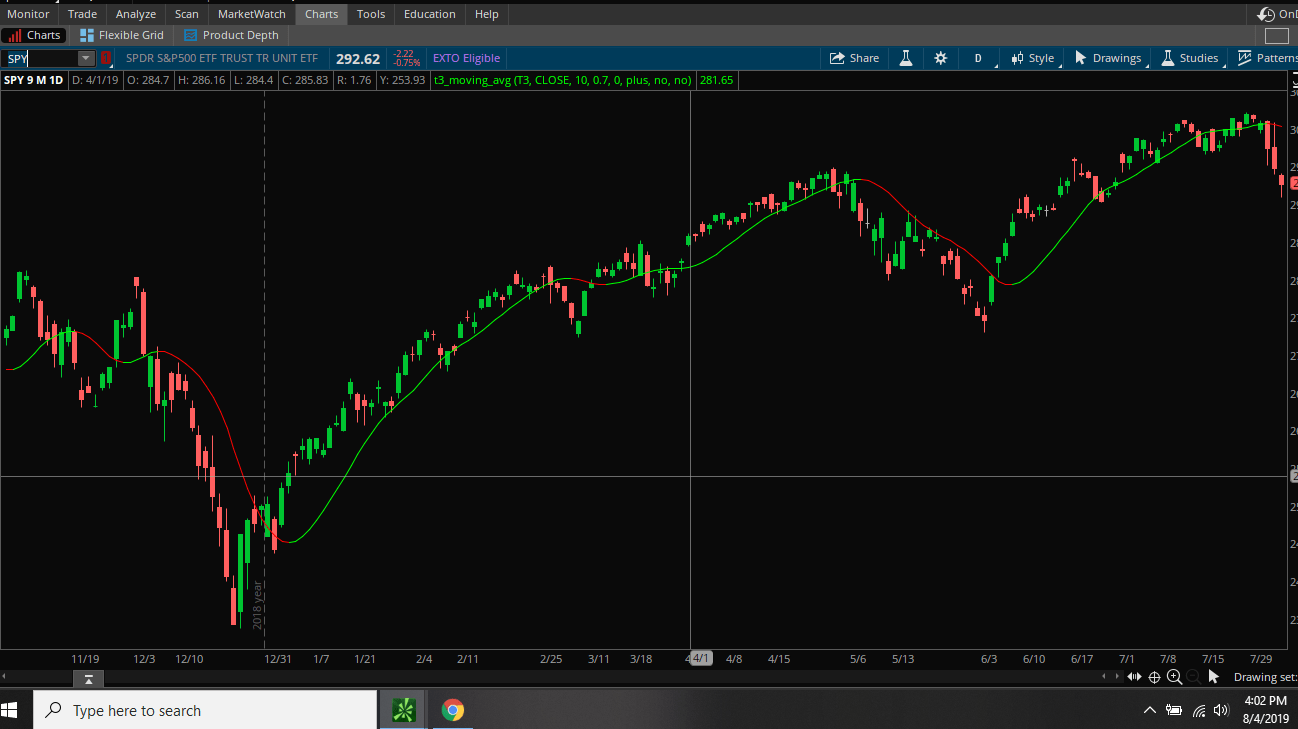
Hello Pete, I have a T3 indicator that displays as color changes(red to green), it works great for the chart but I cant seem to build a scan off it. I have been told that is because scans only recognize numbers not colors. How can I change this script to be used in a scan. Below is the code and a screen shot of how it looks when its used.

#hint:<b>T3 Adaptive Smoothing Indicator</b>\nThis study was adopted from the Technical Analysis of Stocks and Comodities article “Smoothing Techniques for More Accurate Signals” by Tim Tillson, Jan 1998 (V16:1 pp33-37)
#hint: indicator: Defines the level of filtering to occur, default is 3
#hint: volumeFactor: Adjusts the amplitude of the feedback added back into the base filter

declare upper;

input indicator = { T1, T2, default T3, T4, T5, T6 };
input price = close;
input period = 10;
input volumeFactor = 0.70;
input displace = 0;
input sign = { default plus, minus };
input Label = No;
input paintbars = No;

script _gd {
input _price = close;
input _period = 10;
input _v = 0.70;
input _sign = { default plus, minus };
def _ema = ExpAverage( _price, _period );
plot _gd = ( _ema * ( 1 + _v ) ) – ( ExpAverage( _ema, _period ) * _v );
}

def _t1 = _gd( price[-displace], period, volumeFactor, sign );
def _t2 = _gd( _t1, period, volumeFactor, sign );
def _t3 = _gd( _t2, period, volumeFactor, sign );
def _t4 = _gd( _t3, period, volumeFactor, sign );
def _t5 = _gd( _t4, period, volumeFactor, sign );
def _t6 = _gd( _t5, period, volumeFactor, sign );

plot T3;
switch( indicator ) {
case T1:
T3 = _t1;
case T2:
T3 = _t2;
case T3:
T3 = _t3;
case T4:
T3 = _t4;
case T5:
T3 = _t5;
case T6:
T3 = _t6;
}

T3.AssignValueColor(if T3 > T3[1] then Color.Green else Color.Red);
T3.HideBubble();

AddLabel(Label, if T3 > T3[1] then ” A ” else ” A “, if T3 > T3[1] then Color.Green else Color.Red);

assignPriceColor(if paintbars and T3 <T3[1] then color.dark_red else if paintbars and T3 > T3[1] then color.dark_green else color.CURRENT);


Attachments:
Marked as spam
Posted by (Questions: 1, Answers: 1)
Asked on August 4, 2019 1:05 pm
222 views
0
Private answer

After providing this solution I will update the title of this question to include the full name of the custom indicator you provided: "T3 Adaptive Smoothing Indicator". Because "T3" is completely meaningless without including "Adaptive Smoothing Indicator". This will ensure that folks seeking a solution to this specific indicator will be able to find it quickly using the search function.

Now, on to the solution. Let's take the line of code that sets the color of the moving average in this indicator:

T3.AssignValueColor(if T3 > T3[1] then Color.Green else Color.Red);

This line of code contains all the logic we need to convert this to a scan. (this assumes you already understand how to convert the existing plot statements to def statements as well as deleting all the style statements associated with those plots.

Once you have completed those modifications you simply add this as the last line to run your scan:

plot scan = T3 > T3[1];

And for the red:

plot scan = T3 < T3[1];

Marked as spam
Posted by (Questions: 37, Answers: 4087)
Answered on August 4, 2019 3:53 pm
0
Muchos Gracias for the reply. Sadly I don't know how "convert the existing plot statements to def statements as well as deleting all the style statements associated with those plots". I tried my best by deleting all the lines of code that have color associated with it but then pasted the "plot scan =t3 > t3[1]; at the end but it did not work. can you show me what I am supposed to do?
( at August 4, 2019 7:27 pm)
0
I got it to work after reading over your post and going through some old tutorials.THANK YOU
( at August 5, 2019 6:20 am)