| ♥ 0 |
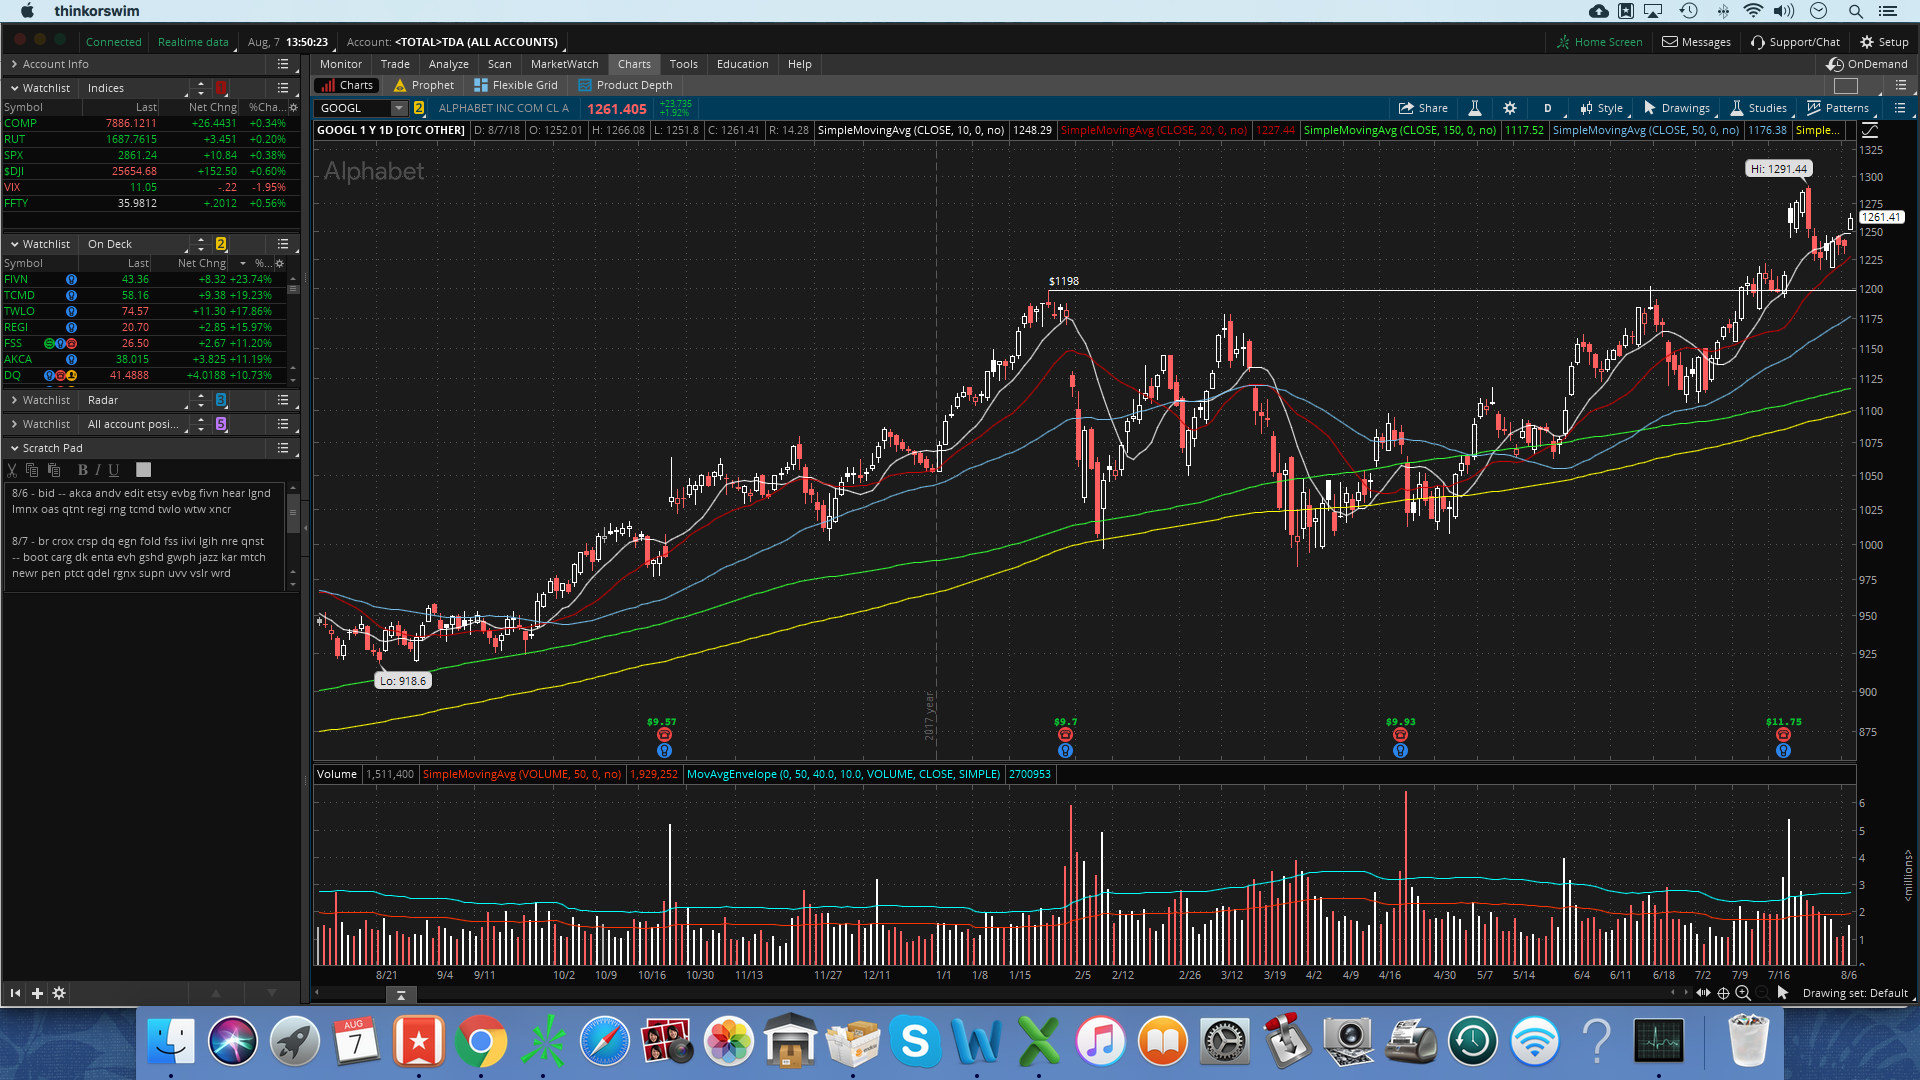
This has been a recurring problem for me the past couple of weeks, and has me at my wit’s end. When I enter a symbol, I get a screen that says “waiting for data”, and it takes a LOOOONG time to pull up the chart, sometimes over a minute. I have spoken to several different TOS tech support reps, and have tried a number of proposed solutions, none of which have worked: -Deleted and re-installed TOS. -Reset my workspace and rebuilt it from scratch. -Run a speed test (87.94 down, 11.71 up). -Checked for “traceroute” issues with my internet. None found. -Increased TOS memory usage to 512 x 2048 MB. I am on an iMac with 8GB of memory, and my OS is fully up-to-date. I also close TOS every night and restart a new session each morning. I’m experiencing no issues whatsoever with any other program on my computer. The problem is most pronounced right after the open and for the first hour of trading, gradually subsides later in the day, then crops up again near the close. That initially made me think it was an issue TOS’s servers getting overloaded during the most active hours, but since I’m not seeing anyone else reporting the issue, I guess it has something to do with my workspace. I’ve attached a screenshot so you can see my layout. As you can see, it’s pretty basic, but maybe some of the more seasoned eyes out there can spot something. Has anyone else ever experienced this problem? And/or, any proposed solutions not listed above? A big part of my strategy involves buying stocks near the open, so this issue has caused me to miss out on many a trade. Attachments:
Marked as spam
Asked on August 7, 2018 11:26 am
7644 views
|
|
Private answer
Just wanted to follow up with the solution here in case anyone ever encounters a similar problem. After weeks of back-and-forth with TOS reps and getting nowhere, I ended up figuring it out by myself. The lag was caused by my having the “adjust for dividends” box in my chart settings set to “All”. Marked as spam
Answered on August 20, 2018 7:16 am
|
|||||||
|
Private answer
Over the past couple of months I noticed that my charts were loading very slowly right after the bell and right before the close. I contacted Schwab and got commiseration, but no real help. Then I tried everything mentioned in this and other threads to troubleshoot my MacBook, adjusting memory, deleting watchlists, removing indicators, etc. But then I noticed that I had the same problem with ToS charts on my iPhone. That seemed to indicate that the problem wasn't necessarily at my end. Another interesting observation was that not all of my charts were delayed. The five-minute charts loaded right away, as did the weekly charts. But my main view, the 2-hour chart, could take minutes to load -- for up to an hour after the bell! How could some charts load while my 2-hour charts couldn't? After some more research, I found this: a 2-hour (120-min) chart is a valid but less common aggregation in TOS; it exists in the platform’s docs, but it’s not a default most people use or that vendors heavily cache. That can mean more on-the-fly aggregation during peak load. US regular session hours are 390 minutes. 120 doesn’t divide evenly into 390 (390 ÷ 120 = 3.25), so each day ends with a partial bar. Partial bars get rebuilt constantly during high-traffic windows (open/close), which can exacerbate lag—whereas 65-min or 130-min bars “fit” perfectly (390/65=6, 390/130=3) and are cheaper to recompute. So I tried loading a 65-minute chart, and it loaded immediately (while the 2-hour chart still wouldn't load). Same thing with a 130-minute chart. Using this duration, the charts load rapidly. While I'm not planning to start using the 130-minute chart as my standard, in early trading when I need to run through a lot of charts quickly, I'll use the 130-minute duration. If I see something that might be actionable, I'll switch back to 2-hour and wait the 1-2 minutes for it to load to verify what I saw on the 130-minute chart. About an hour into the session, I'll switch back completely to the 2-hour duration. This has been a daily irritation for me. Since I found what I think is a decent workaround, I thought I'd share it with the community. Marked as spam
Answered on October 2, 2025 3:33 pm
|
|||||||
|
Private answer
Only three things left I can think of. However I will say the most likely culprit is the data feed from the Thinkorswim servers. They are very well known to be heavily impacted by high market volume. Which is the norm during market open and close.
That’s all I’ve got. I can certainly attest to the fact that Thinkorswim has a problem during high market volume. Always has. And I expect it always will. If this problem is preventing you from being a profitable trader you should consider moving to a more advanced trading platform. Most will require Windows to run. But you can run that via Bootcamp or via a Virtual Machine. (I personally use Parallels for my VM). Works excellent and I use it to run TradeStation and Sierra Chart. Hope I was able to provide some help.
Attachments:
Marked as spam
Answered on August 7, 2018 12:05 pm
|
|||||||
|
Private answer
I had the similar problem in the Windows PC but the problem was due to high ping from the internet and restarting a router solves my problem when this happens. Based on Pete's solution I learnt that I need to have Java installed which I don't have it too. I was wondering that Java is required in Windows PC. Marked as spam
Answered on September 21, 2019 10:53 pm
|
Fantastic. So glad there was a solution and that you found the answer. And thanks for taking the time to come back and explain what you found. No doubt this will help many others experiencing this issue!