| ♥ 0 |
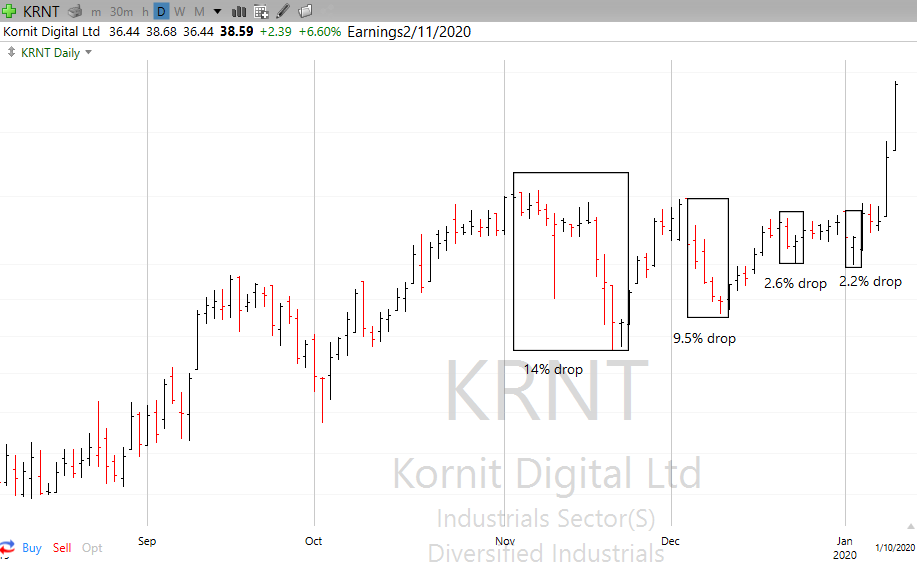
Pete, Hoping you can help with a chart study to identify volatility contraction patterns (VCPs) as defined by Mark Minervini. The volatility contraction pattern (VCP) is characterized by waves (contractions) where the high – low range gets propressively shallower. For example, see attached KRNT chart showing a VCP before rising sharply this month. It had a 14% drop from high to low in November, followed by consecutively smaller drops of 9.5%, 2.6%, and about 2.2%. I’ve identified each contraction of the pattern by a box. It would be great to have a chart study that identifies these contractions when there are two or more consecutively shallower contractions on the daily timeframe. If the high-to-low depth then grows beyond the previous contraction, the contraction count is reset. Thanks. Attachments:
Marked as spam
Asked on January 14, 2020 5:25 pm
3604 views
|