In order to handle the start and end times, I’m going to borrow some code we previously published: https://www.hahn-tech.com/thinkorswim-overnight-range-scan-alert/
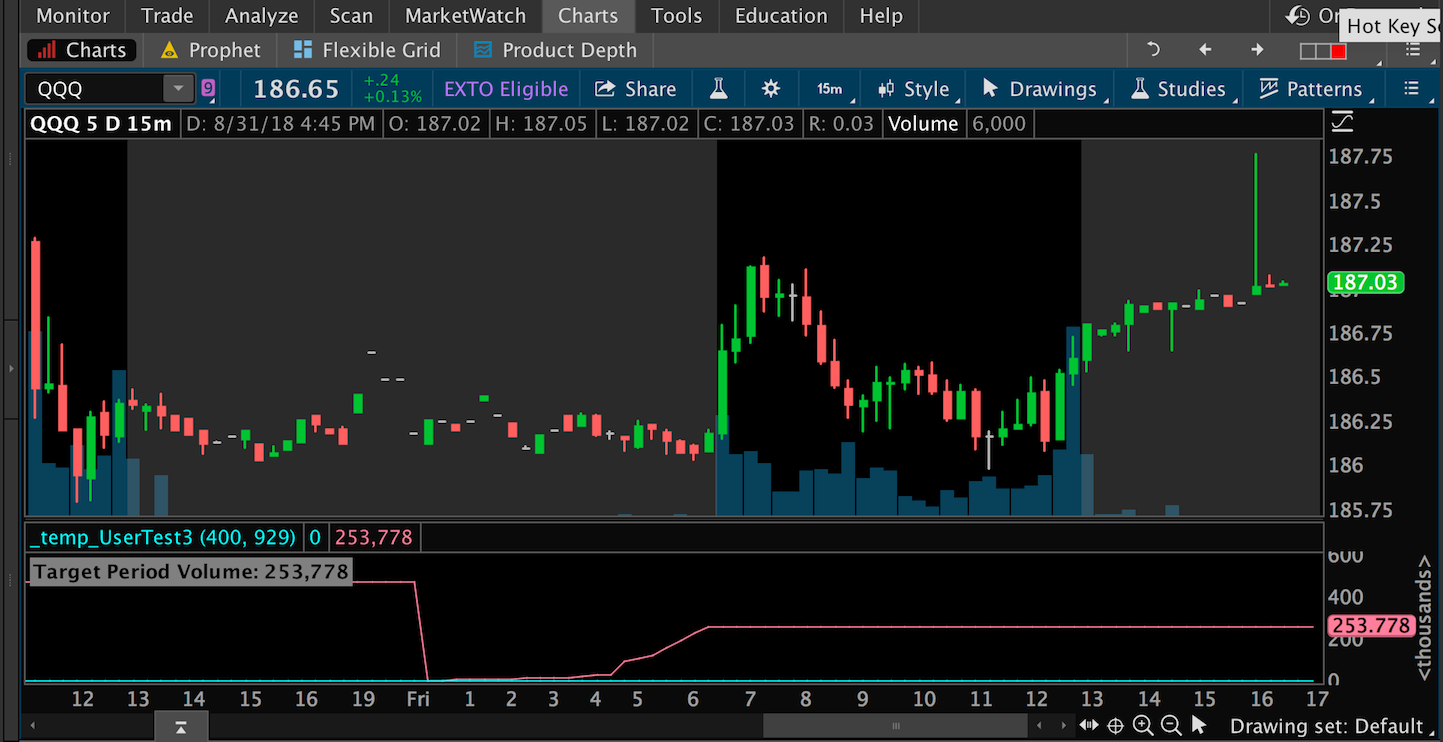
The code will plot a chart label that contains the total volume for the target period.
input startTime = 400;

input endTime = 929;

def startCounter = SecondsFromTime(startTime);

def endCounter = SecondsTillTime(endTime);

plot targetPeriod = if startCounter >= 0 and endCounter >= 0 then 1 else 0;

rec volumeTotal = if targetPeriod and !targetPeriod[1] then volume else if targetPeriod then volumeTotal[1] + volume else volumeTotal[1];

AddLabel(yes, Concat("Target Period Volume: ", volumeTotal), Color.GRAY);
Screenshot below shows how the computations are accumulated through the target period and held until the next target period begins.
Edit:
After providing the solution shown above, the viewer has requested two additional items to be added to the chart. See the comment section below for details. The second version of the code follows:
input startTime = 400;

input endTime = 929;

def startCounter = SecondsFromTime(startTime);

def endCounter = SecondsTillTime(endTime);

def targetPeriod = startCounter >= 0 and endCounter >= 0;

rec volumeTotal = if targetPeriod and !targetPeriod[1] then volume else if targetPeriod then volumeTotal[1] + volume else volumeTotal[1];

rec targetHighest = if targetPeriod and !targetPeriod[1] then high else if targetPeriod and high > targetHighest[1] then high else targetHighest[1];

rec targetLowest = if targetPeriod and !targetPeriod[1] then low else if targetPeriod and low < targetLowest[1] then low else targetLowest[1];

AddLabel(yes, Concat("Target Period Volume: ", volumeTotal), Color.GRAY);

AddLabel(yes, Concat("Target Period Highest: " , targetHighest), Color.GRAY);

AddLabel(yes, Concat("Target Period Lowest: ", targetLowest), Color.GRAY);
Hey Mr. Hahn. Can you please help me edit this existing code here?
input startTime = 930;
input endTime = 1031;
def startCounter = SecondsFromTime(startTime);
def endCounter = SecondsTillTime(endTime);
plot targetPeriod = if startCounter >= 0 and endCounter >= 0 then 1 else 0;
rec volumeTotal = if targetPeriod and !targetPeriod[1] then volume else if targetPeriod then volumeTotal[1] + volume else volumeTotal[1];
AddLabel(yes, Concat(“1stHRvol: “, volumeTotal), Color.LIGHT_GRAY);
what I’d like to do is be able to scroll back and get the values (pm high & low, pm volume) for whichever day the chart is currently on.
Also need to edit these 2 codes do do the same thing (1st hour Volume and 2nd hour Volume):
input startTime = 930;
input endTime = 1031;
def startCounter = SecondsFromTime(startTime);
def endCounter = SecondsTillTime(endTime);
plot targetPeriod = if startCounter >= 0 and endCounter >= 0 then 1 else 0;
rec volumeTotal = if targetPeriod and !targetPeriod[1] then volume else if targetPeriod then volumeTotal[1] + volume else volumeTotal[1];
AddLabel(yes, Concat(“1stHRvol: “, volumeTotal), Color.LIGHT_GRAY);
input startTime = 1031;
input endTime = 1131;
def startCounter = SecondsFromTime(startTime);
def endCounter = SecondsTillTime(endTime);
plot targetPeriod = if startCounter >= 0 and endCounter >= 0 then 1 else 0;
rec volumeTotal = if targetPeriod and !targetPeriod[1] then volume else if targetPeriod then volumeTotal[1] + volume else volumeTotal[1];
AddLabel(yes, Concat(“2ndHRvol: “, volumeTotal), Color.LIGHT_GRAY);
If I understand what you are requesting, this is impossible to do on Thinkorswim. So let me explain what I think you are asking and correct me if I’m wrong. You want the chart labels to change the value they display based on the activity of you scrolling through the bars on the chart.
If this is what you are requesting, it is completely impossible. Thinkorswim does not provide anything in their programming language to do this.