VWAP on Price Axis


Category:
0
0

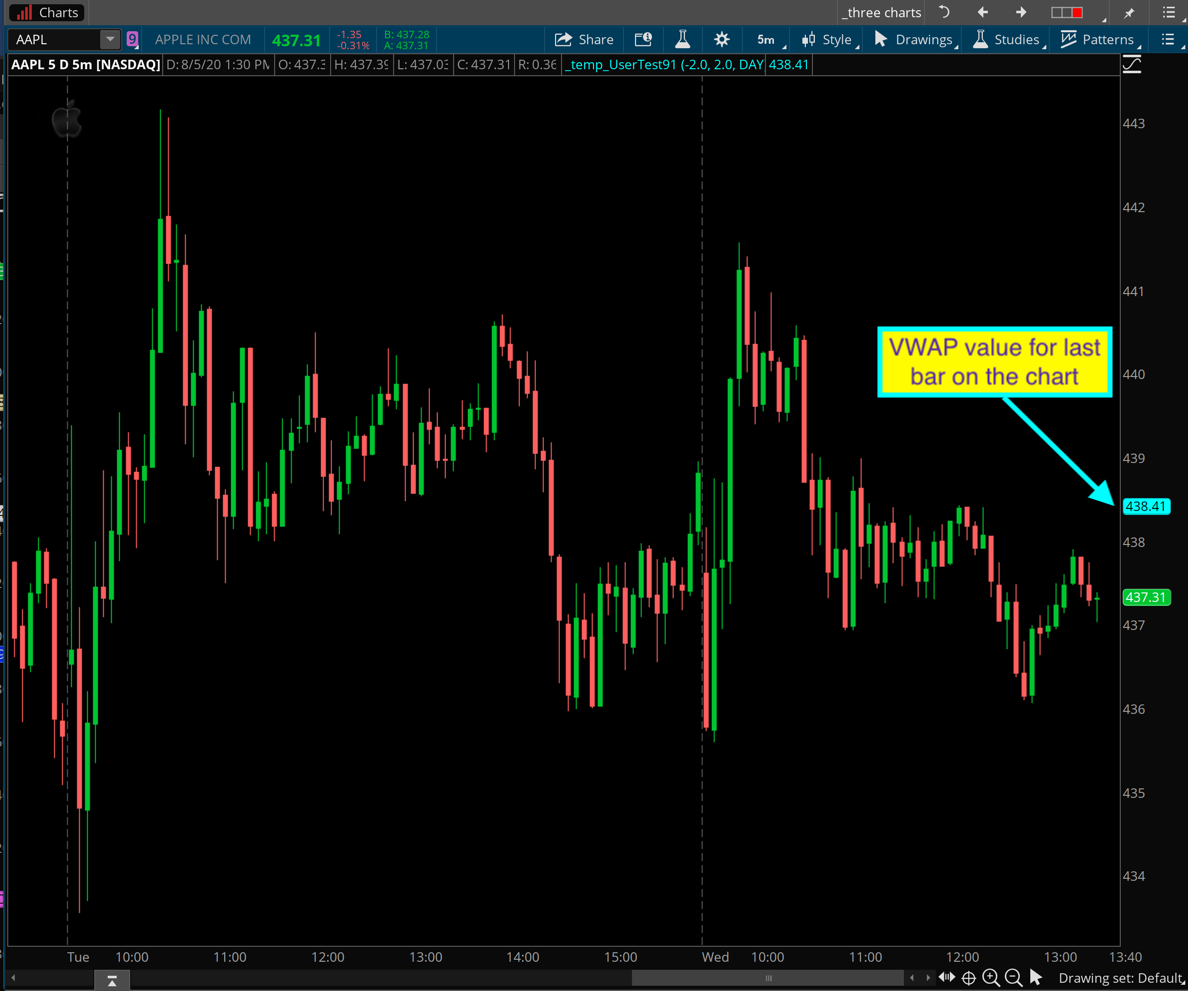
Is it possible to display the VWAP along the price axis without having it displayed on the chart?  I find the lines to be distracting from other indicators. I am not interested in plotting the outside top and bottom lines.

RESOLVED
Marked as spam
Posted by (Questions: 6, Answers: 11)
Asked on August 5, 2020 8:25 am
113 views
0
Private answer

The only way to display anything on the price range at the far right-hand side of the chart is to plot it. So the best we can do here is to configure the plot of the VWAP to only display on the last bar of the chart. Since the code for the VWAP is very long I will use a shortcut and reference the chart study rather than provide the full code in my solution.

input numDevDn = -2.0;
input numDevUp = 2.0;
input timeFrame = {default DAY, WEEK, MONTH};
def myVwap = reference VWAP(numDevDn, numDevUp, timeFrame).VWAP;
def lastBar = !IsNaN(close) and IsnaN(close[-1]);
plot vwapLastBar = if lastBar then myVwap else Double.NaN;

Screenshot below shows the result. You an update the color of the plot through the Edit Studies window.

Attachments:
Marked as spam
Posted by (Questions: 37, Answers: 4086)
Answered on August 5, 2020 10:35 am
0
Thank you very much. This answers the question perfectly and keeps my charts clean as possible
( at August 5, 2020 11:02 am)