| ♥ 0 |
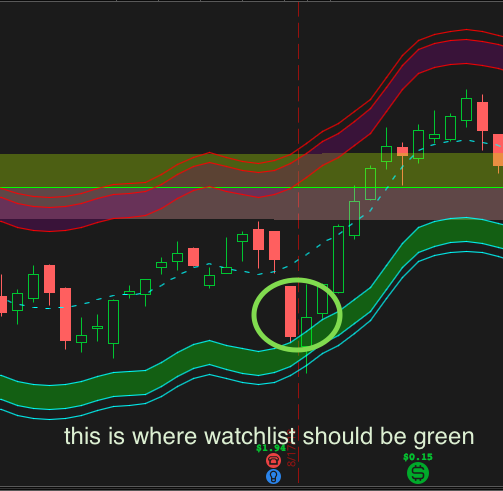
hi pete. i have this indicator i am trying to adjust for my watchlist. this is the code for the indicator: input price = close; and this is me trying to get the watchlist to turn green when price is below LowerLine and red when price is above UpperLine. but it does not work. i will add screenshots to help explain. thank you for your time. -josh- input price = close; AssignBackgroundColor (if close > UpperLine then color.DARK_RED else if close < LowerLine then color.DARK_GREEN else color.CURRENT);
Attachments:
Marked as spam
Asked on February 22, 2020 8:20 pm
102 views
|
|
Private answer
The code contains a call to a function named "HighestAll()". This function gets the highest value for the data loaded on the chart. Change the amount of data on the chart and this indicator changes. So if you have 1 year of daily bars the values will change when you load 2 years of daily bars. The reason y0ur attempts do not match is the amount of data used to compute the values in the watchlist column does not match the amount of data on the chart. The amount of historical data available to a watchlist column varies based on the selected time frame. Full details at the bottom of this post: https://toslc.thinkorswim.com/center/howToTos/thinkManual/MarketWatch/Quotes/customquotes The problem here is we have absolutely no way to adjust the amount of historical data on a watchlist column as we can with a chart. So if you want them to match you will need to adjust the amount of data loaded on your chart, to EXACTLY match the amount of data available to the watchlist column at the time frame selected. (which means that link above is your decoder ring). Because these plots will change when you adjust the historical data on the chart I suggest you don't really have a viable piece of code here. Marked as spam
Answered on February 23, 2020 8:32 am
|