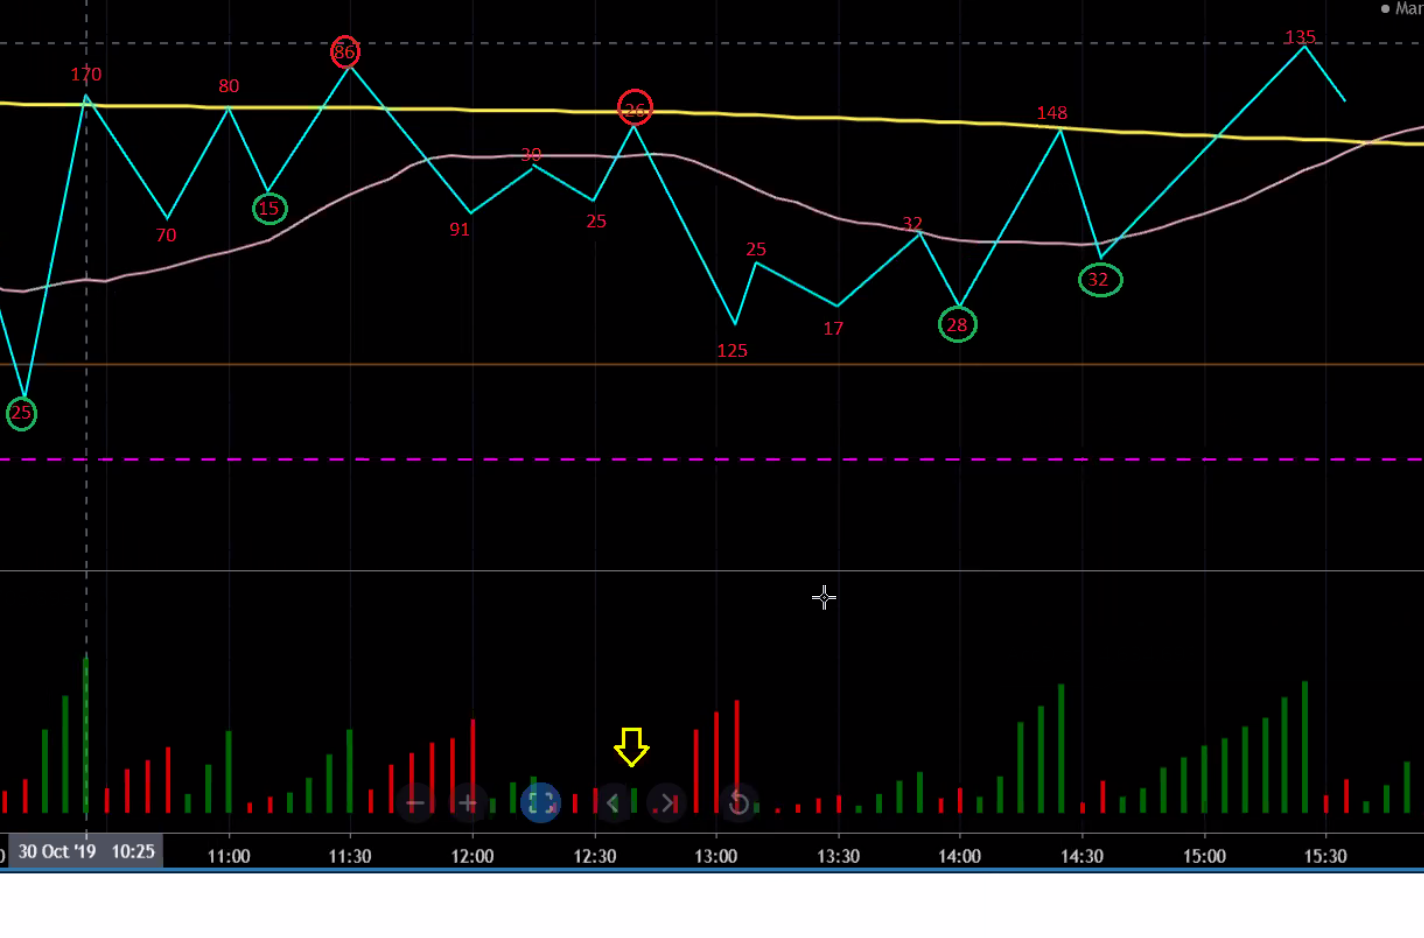
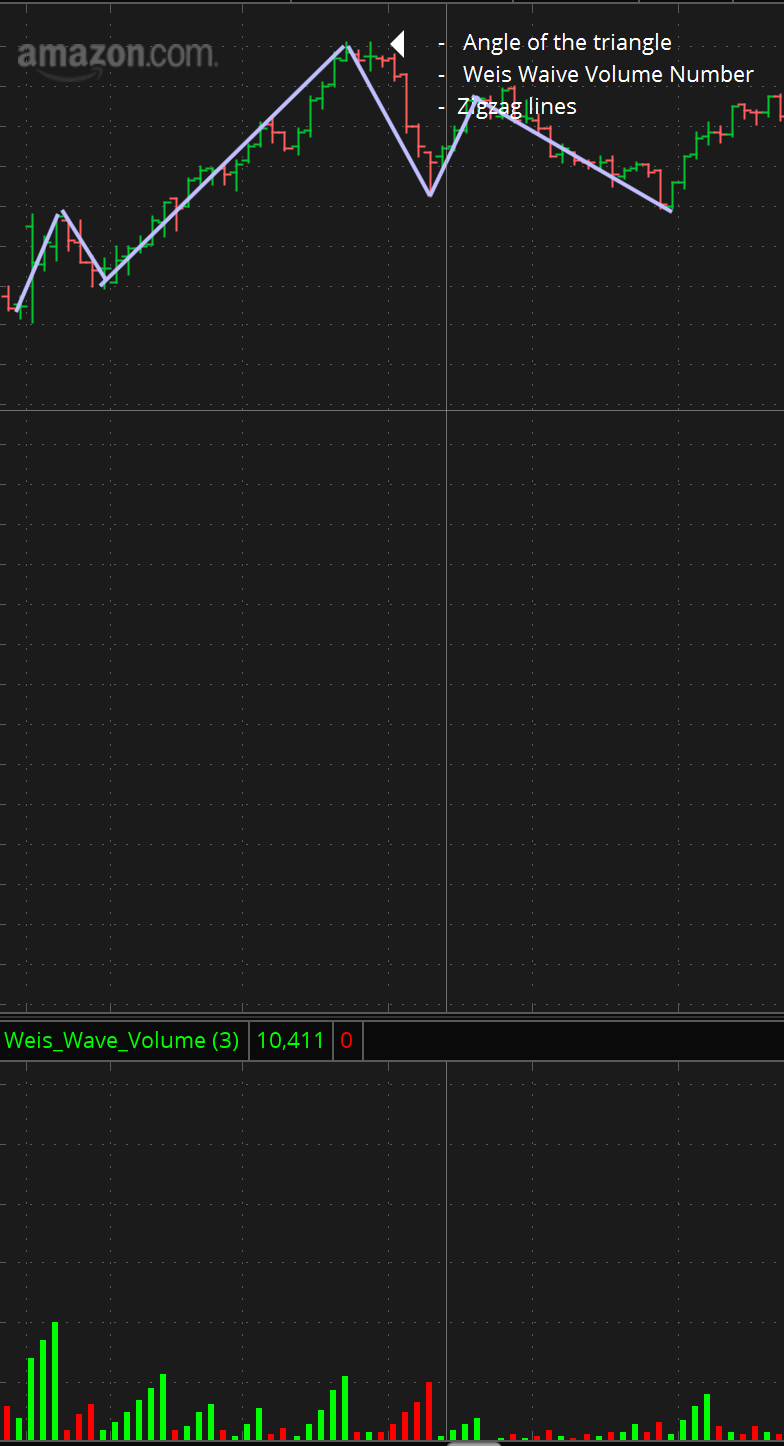
Frank, here is the Weis Wave Volume thinkscript.
declare lower;
def price = hlc3;
input reversalAmount = 1.5;
input reversalMode = {price, default percent};
def mode = if reversalMode == reversalMode.price then ZigZagTrendSign(price = price, reversalAmount = reversalAmount) else ZigZagTrendPercent(price = price, reversalAmount = reversalAmount);
def inflection = if reversalMode == reversalMode.price then if !IsNaN(ZigZagSign(price = price, reversalAmount = reversalAmount)) then 1 else 0 else if !IsNaN(ZigZagPercent(price = price, reversalAmount = reversalAmount)) then 1 else 0;
rec trend = if inflection == 1 and mode == -1 then 1 else if inflection == 1 and mode == 1 then -1 else trend[1];
rec upWaveVolume = if inflection == 1 and trend == 1 and close > open then volume else if inflection == 1 and trend == 1 and close <= open then 0 else if trend == 1 or (inflection == 1 and trend == -1 and close >= open) then upWaveVolume[1] + volume else 0;
rec downWaveVolume = if inflection == 1 and trend == -1 and close < open then volume else if inflection == 1 and trend == -1 and close >= open then 0 else if trend == -1 or (inflection == 1 and trend == 1 and close <= open) then downWaveVolume[1] + volume else 0;
plot upvol = upWaveVolume;
upvol.SetDefaultColor(color.dark_green);
upvol.SetPaintingStrategy(PaintingStrategy.Histogram);
upvol.SetLineWeight(5);
plot dnvol = downWaveVolume;
dnvol.SetDefaultColor( Color.DownTICK);
dnvol.SetPaintingStrategy(PaintingStrategy.Histogram);
dnvol.SetLineWeight(5);