There are probably a couple of details you left out so I had to make some guesstimates. This solution should get you 99% of the way toward your stated goal.
input maLengthOne = 21;
input maTypeOne = AverageType.EXPONENTIAL;
input maPriceOne = close;
def maOne = MovingAverage(maTypeOne, maPriceOne, maLengthOne);
rec trackCrossAbove = if close < maOne then 0 else if close > maOne then 1 else trackCrossAbove[1];
rec trackCrossBelow = if close > maOne then 0 else if close < maOne then 1 else trackCrossBelow[1]; def bullishCandle = close > open;
def bearishCandle = close < open;
rec trackFirstBearish = if trackCrossAbove and !trackCrossAbove[1] then 0 else if bearishCandle then 1 else trackFirstBearish[1];
rec trackFirstBullish = if trackCrossBelow and !trackCrossBelow[1] then 0 else if bullishCandle then 1 else trackFirstBullish[1];
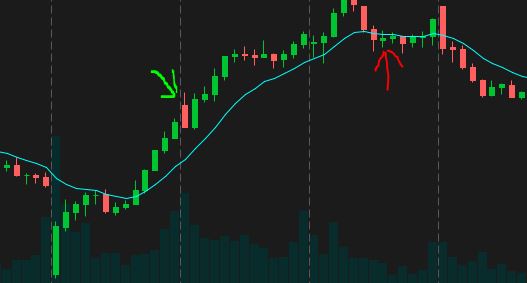
# use this to scan for first bearish candle after price crosses above ma
plot scan = trackFirstBearish and !trackFirstBearish[1];
# use this to scan for first bullish candle after price crosses below ma
#plot scan = trackFirstBullish and !trackFirstBullish[1];
As with all of my scans which include multiple scan signals, simply read the comment lines above each plot scan statement and move the "#" symbol to select which signal you want to run.