Ok, with the screenshots provided by Charanjit Jootla on 6/15/17 we can proceed with the solution.
There are two main factors at play here and it’s very important you understand them. These factors will impact other indicators too. Unless you fully grasp what I am explaining here you may end up with bad data and not even know it.
The factors are:
- Historical Data Limitations for Scans
- Cumulative Indicators
Historical Data Limitations:
The amount of historical data available when running a scan depends on the aggregation period selected. In the case of daily, the limit is 730 calendar days.
You can get the full details here: https://www.hahn-tech.com/ans/how-to-add-audible-alertnotification-to-ttm-scalper-alert/
Cumulative Indicators:
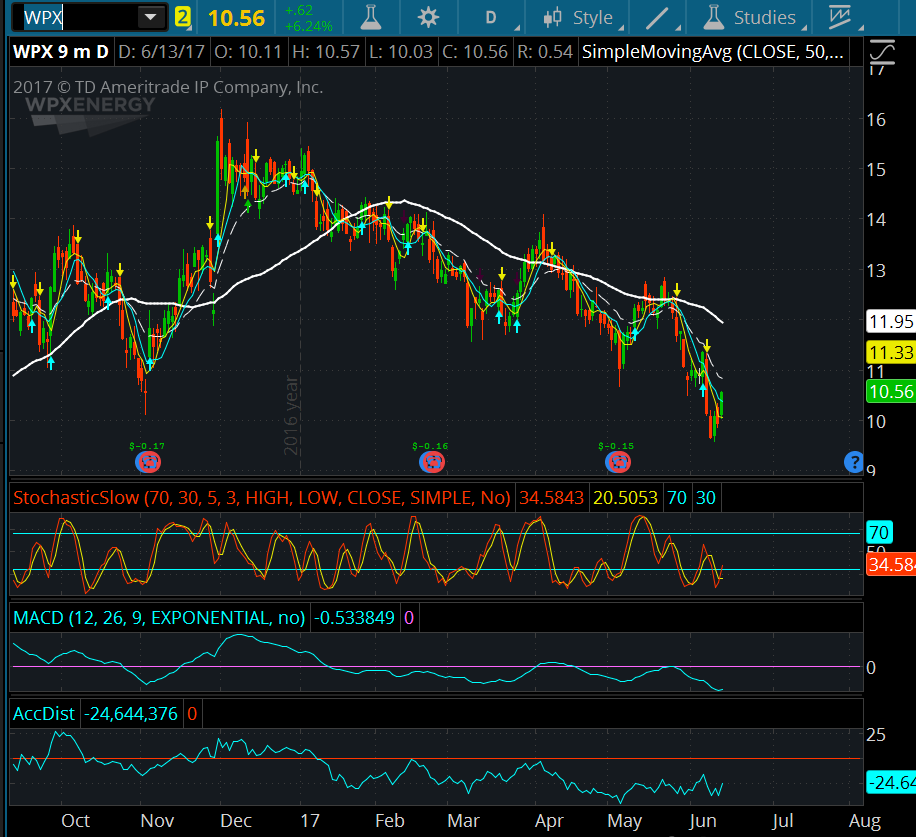
In our current example, the AccDist study uses a function called TotalSum(). Which indiscriminately captures the value of every single candle available to it. The more candles on the chart (or in the scan) the more candles are included in the grand total. So when you have a chart of 9 months of daily candles you will get a different value than a chart of 12 months of daily candles. If you think about that a few minutes you will likely conclude that testing if this particular indicator has crossed the zero line is meaningless. The only way in which to give it meaning, is to specify the exact starting point. How you select that starting point is up to you. I don’t have a clue what makes sense here so in my example I am using a date 9 months prior to the date of this post. I only selected 9 months because your screenshot showed a chart with 9 months of daily bars.
Ok, I hope you have been able to assimilate these details. As I mentioned earlier, these factors can impact many other indicators out there.
You can see our solution to the RelativeStrength indicator here: https://www.hahn-tech.com/thinkorswim-scan-relative-strength/
Be sure to check out that video because part of the solution I provide here was taken from that code.
Ok so before I present the code I’ll describe the two screenshots I’ve included.
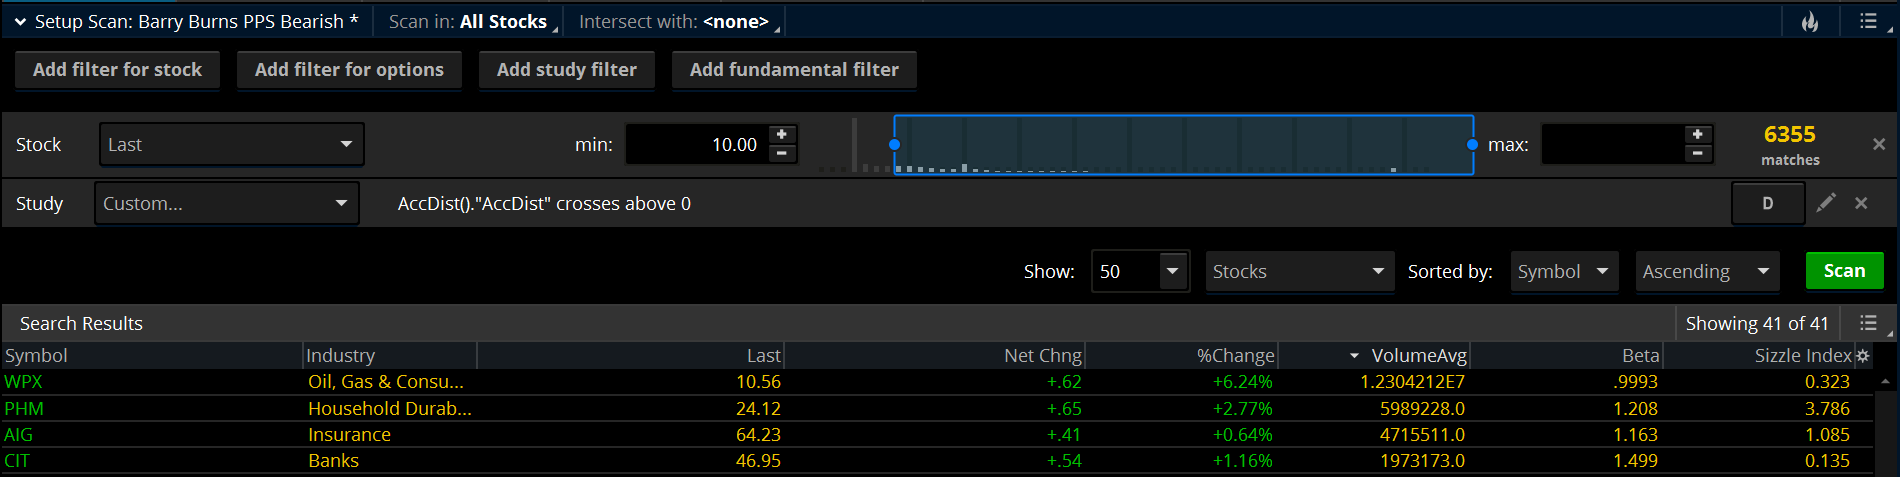
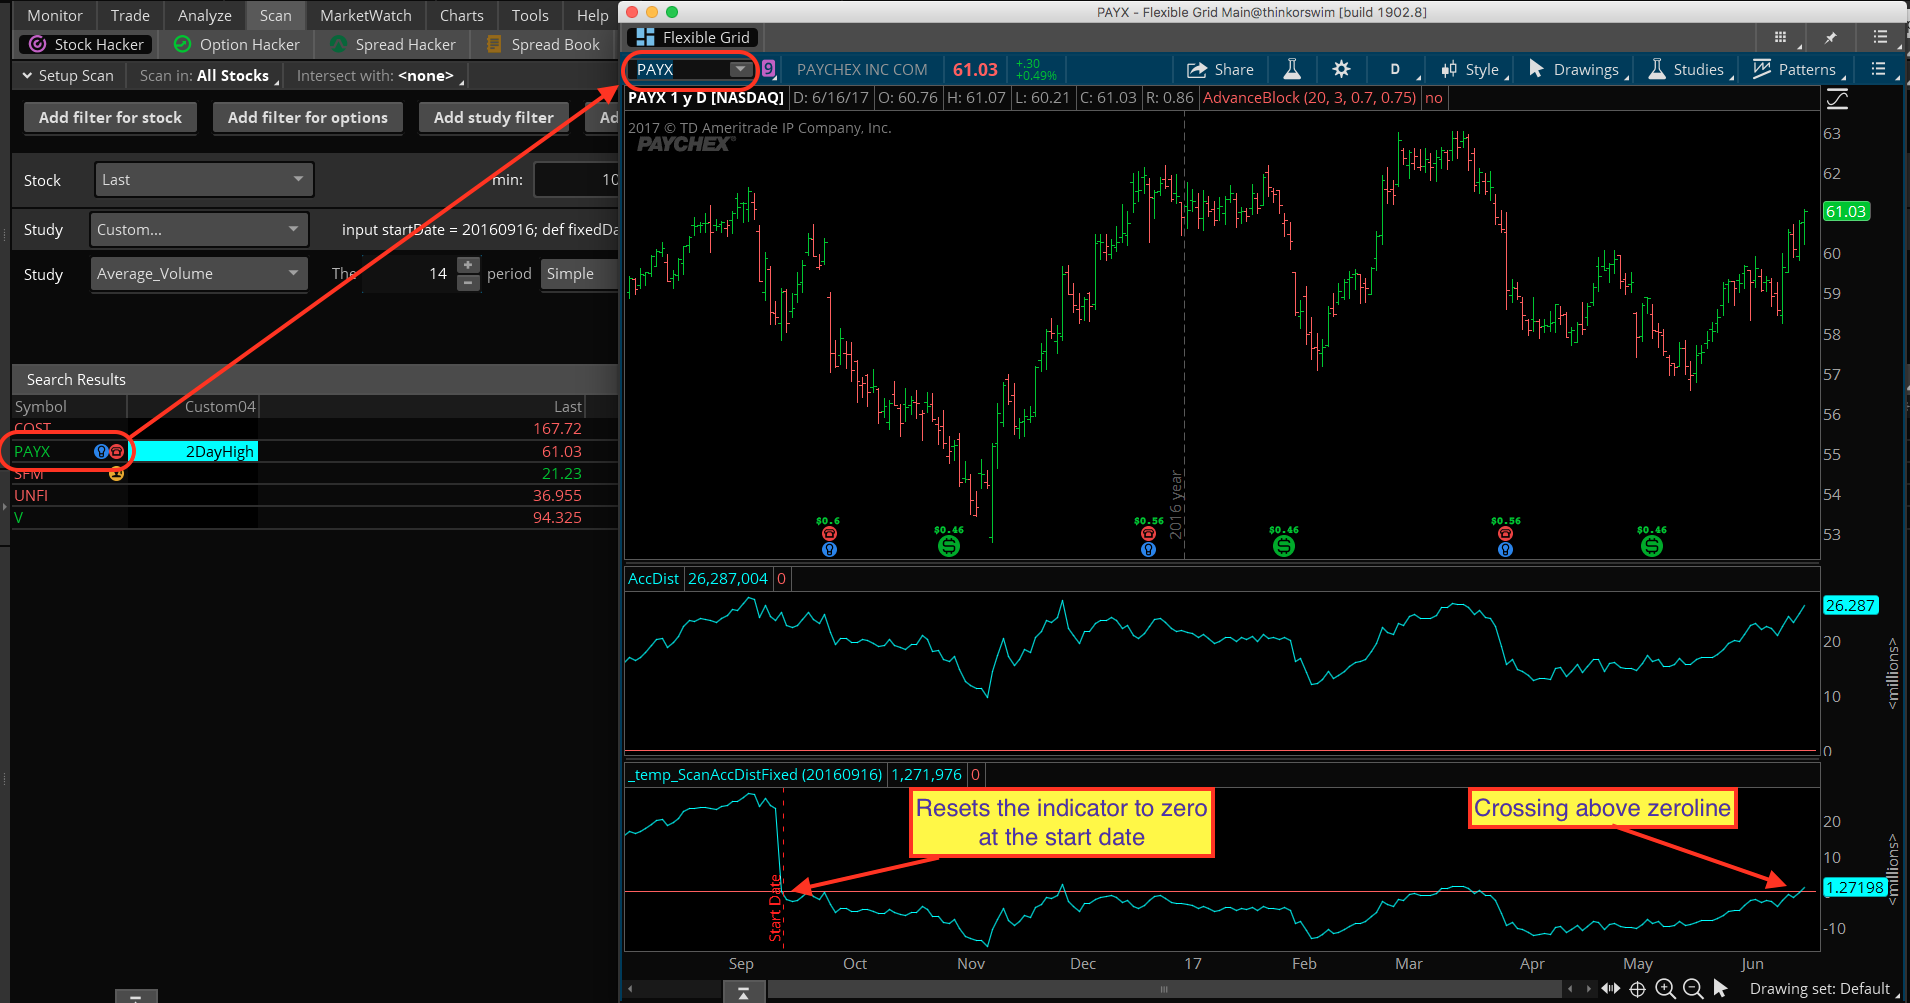
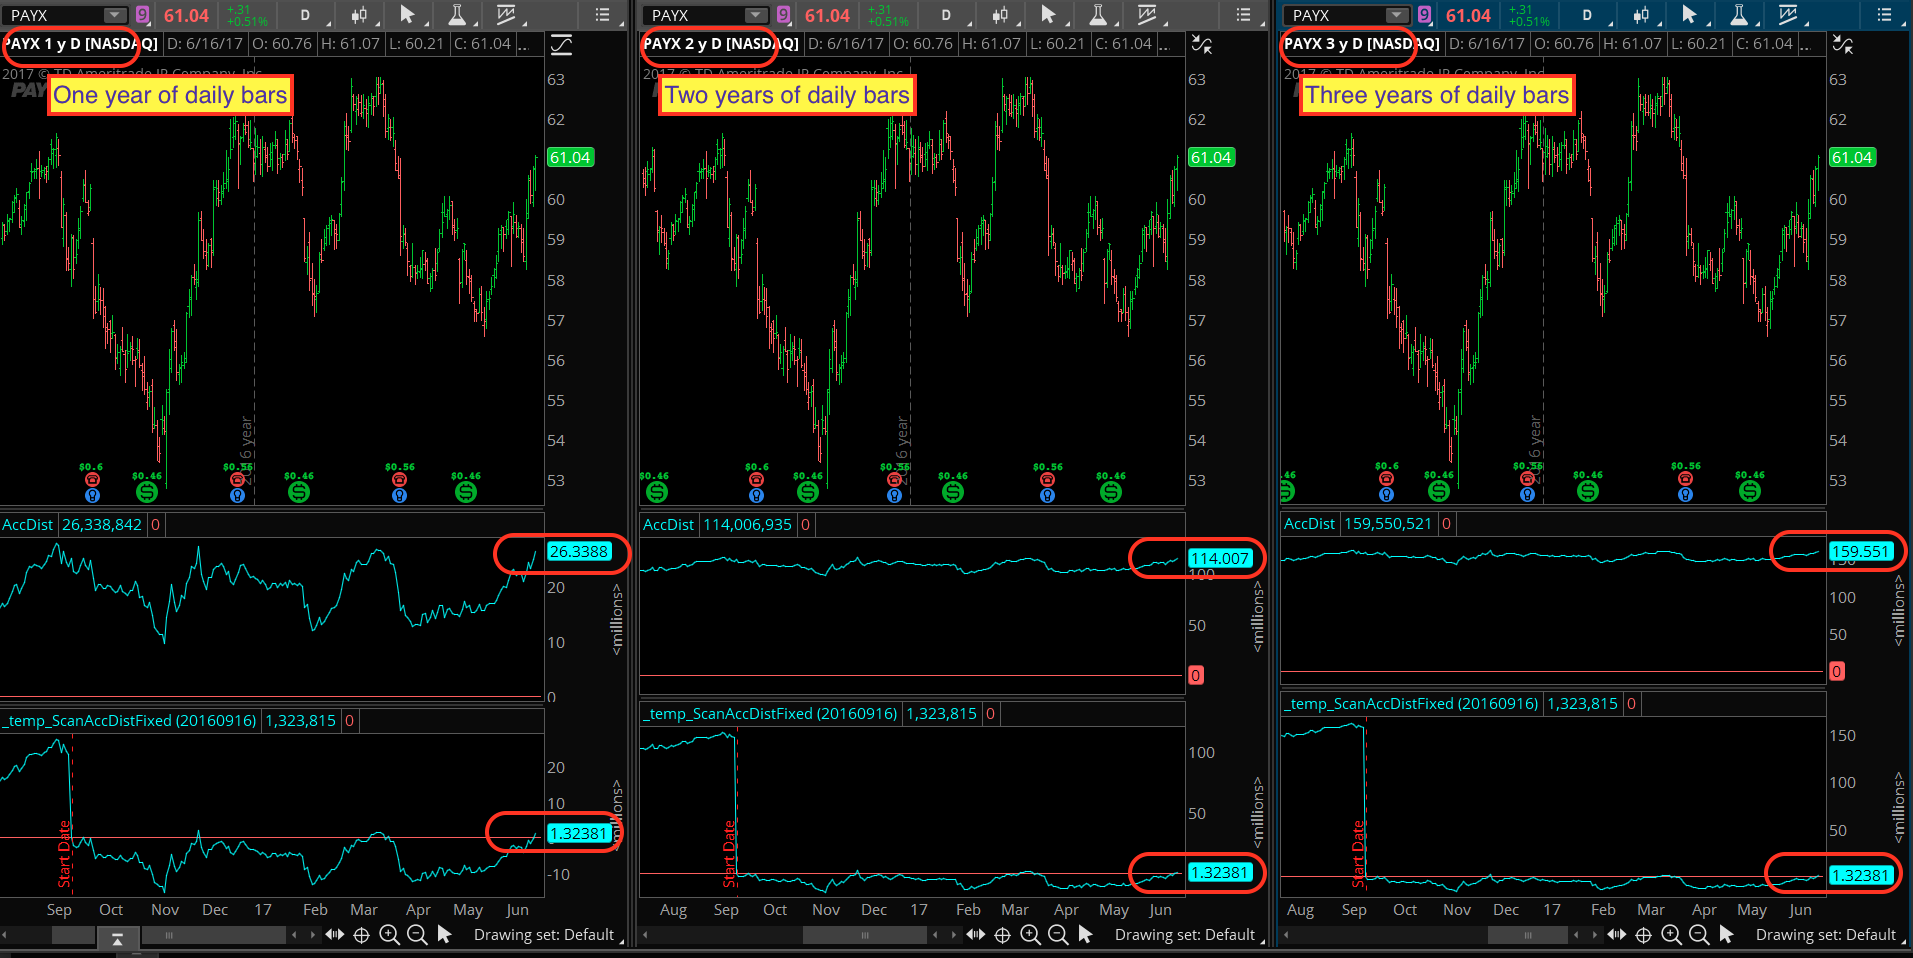
One of them shows the scan results on the left, with a chart on the right. The chart contains the builtin AccDist study as well as my customized version. The customized version resets the value of the plot to zero at the start date (9/15/16). Notice the scan has correctly picked up the plot crossing above the zeroline. The other screenshot shows a set of three charts. This is to demonstrate the impact of adding more data to the chart. From left to right we have 1yr of daily bars, 2yr of daily bars and 3yr of daily bars. Notice how for each chart, the builtin AccDist displays a completely different value.
To my mind, whether the line is above or below zero is meaningless. The only value I can see is to look at the trend of the plot. And perhaps look for divergence patterns.
Ok, here is the code to build the custom scan:
input startDate = 20160916;

def fixedDate = DaysFromDate(startDate) == 0;

AddVerticalLine(fixedDate == 1, "Start Date", Color.RED);

def value = volume * CloseLocationValue();

def fixedAccDist = CompoundValue(1, if fixedDate == 1 then 0 else fixedAccDist[1] + value[1], 0);

def custAccDist = fixedAccDist[-1];

def crossesAbove = custAccDist[1] < 0 and custAccDist > 0;

def crossesBelow = custAccDist[1] > 0 and custAccDist < 0;

# use this to scan for crosses above zeroline

plot scan = crossesAbove;

# use this to scan for crosses below zeroline

#plot scan = crossesBelow;
Here is the code to plot on your charts:
declare lower;

input startDate = 20160916;

def fixedDate = DaysFromDate(startDate) == 0;

AddVerticalLine(fixedDate == 1, "Start Date", Color.RED);

def value = volume * CloseLocationValue();

def fixedAccDist = CompoundValue(1, if fixedDate == 1 then 0 else fixedAccDist[1] + value[1], 0);

plot custAccDist = fixedAccDist[-1];

plot ZeroLine = 0;

custAccDist.SetDefaultColor(GetColor(1));

ZeroLine.SetDefaultColor(GetColor(5));
It would be best if you would also supply some screenshots showing how you have setup the scan and the chart.