| ♥ 0 |
A viewer has asked to have some previously published code to be modified slightly. The code was originally published as nothing more than an exercise, teaching how to combine two indicators into a single custom study. Link: https://www.hahn-tech.com/thinkorswim-custom-scan-stochastic-macd/ In creating the video, I had randomly selected the MACD and the Stochastic. However, based on previous comments on YouTube, as well as this viewer’s request; it seems I accidentally landed on an actual trade setup. (well, pretty close anyway). So I did some research to see if what this viewer was requesting had actually been published before, by an authoritative source. Turns out it is quite a popular setup. I’ll provide just a couple links from the Google search that I performed: http://www.investopedia.com/articles/forex/07/stochastic_snap.asp Those articles line up very well with the specifications requested by this viewer.
Marked as spam
|
|
Private answer
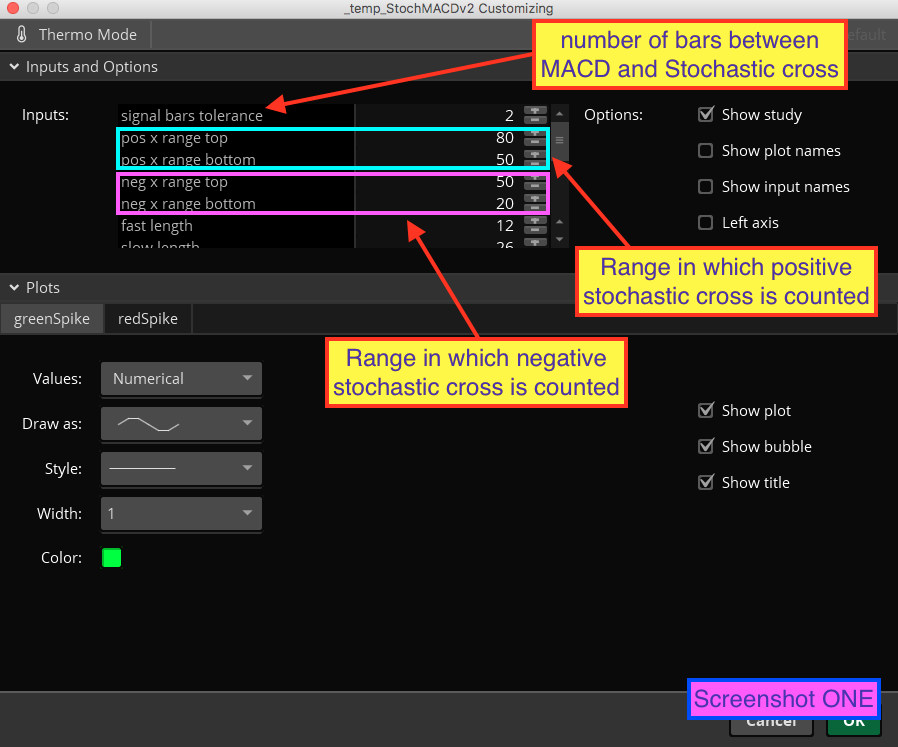
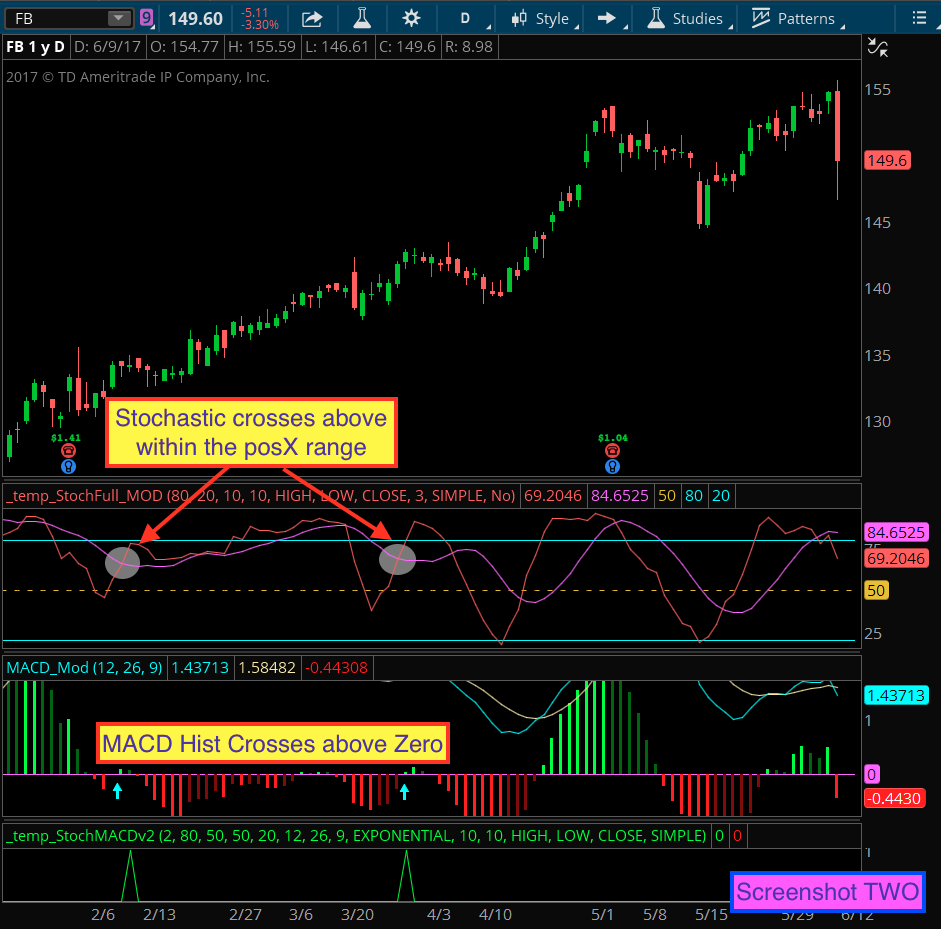
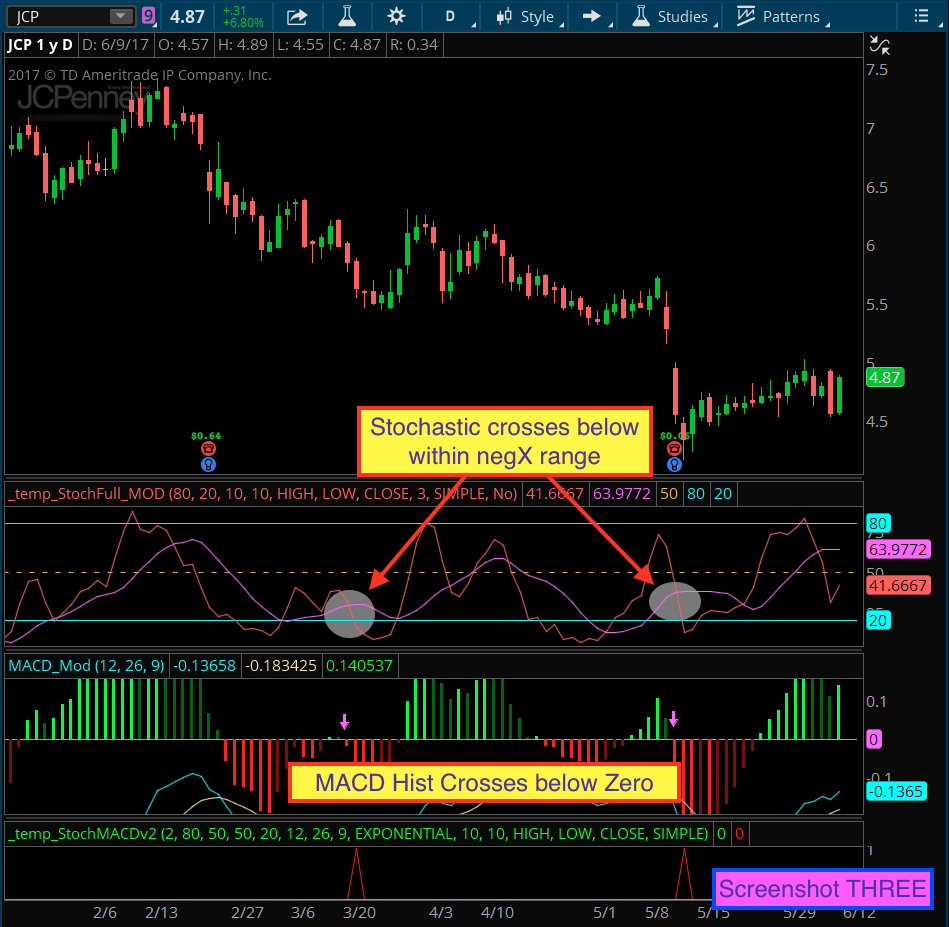
Now before asking questions, be sure to read those articles. Do some additional research on the topic. Then play around with this code to see how it may be able to do the job. I am providing three screenshots to help you see how the settings impact the signals. I will refer to those screenshots as I describe the settings. Each screenshot is numbered. In screenshot ONE you see the settings. The comments point to specific settings. The first setting tells the code how many bars to allow between the Stochastic cross and the MACD cross. The rarely occur on the same bar. The next four settings are grouped in pairs. Each pair control the upper and lower range within which a Stochastic cross will be counted as valid. (you will likely want to experiment with different ranges after doing your research). In screenshot TWO we see the custom study at the bottom, plotting green spikes. You see the Stochastic crossing above, within the range established by the default settings. Then you see the MACD cross above zero within 1-2 bars. In screenshot THREE we see the same study at the bottom plotting red spikes. You see the Stochastic crossing below, within the range established by the default settings. Then you also see the MACD cross below zero within 1-2 bars. The code is posted below. But I know many of you will be asking if we can make this into a scan. So immediately below the code I will show which lines to change in order to make this into a scan.
Ok, this next bit is for those looking to use this as a scan. From the code listed above, delete the last four lines. Then add these new lines to build your scans.
The prerequisite to building and using this as a custom scan is to watch a few of our videos on that topic. You can find them listed at the top of the page under the menus item titled “Free Tutorials”. Attachments:
Marked as spam
Answered on June 11, 2017 12:27 pm
|
For those who would like to use workspace sharing I am providing a link. This link is for an entire chart grid, the StochMACD indicator is included. http://tos.mx/B7ebLF