Adaptive Moving Average Crossover Watchlist Column


Category:
0
0

How do I make a ThinkorSwim watchlist column that would let me know when the stock price crosses the MovAvgAdaptive(Close,5,2,30,AMA) in the plus(green) and in the minus(red) direction?

Marked as spam
Posted by (Questions: 5, Answers: 5)
Asked on September 17, 2019 11:54 am
231 views
0
Private answer

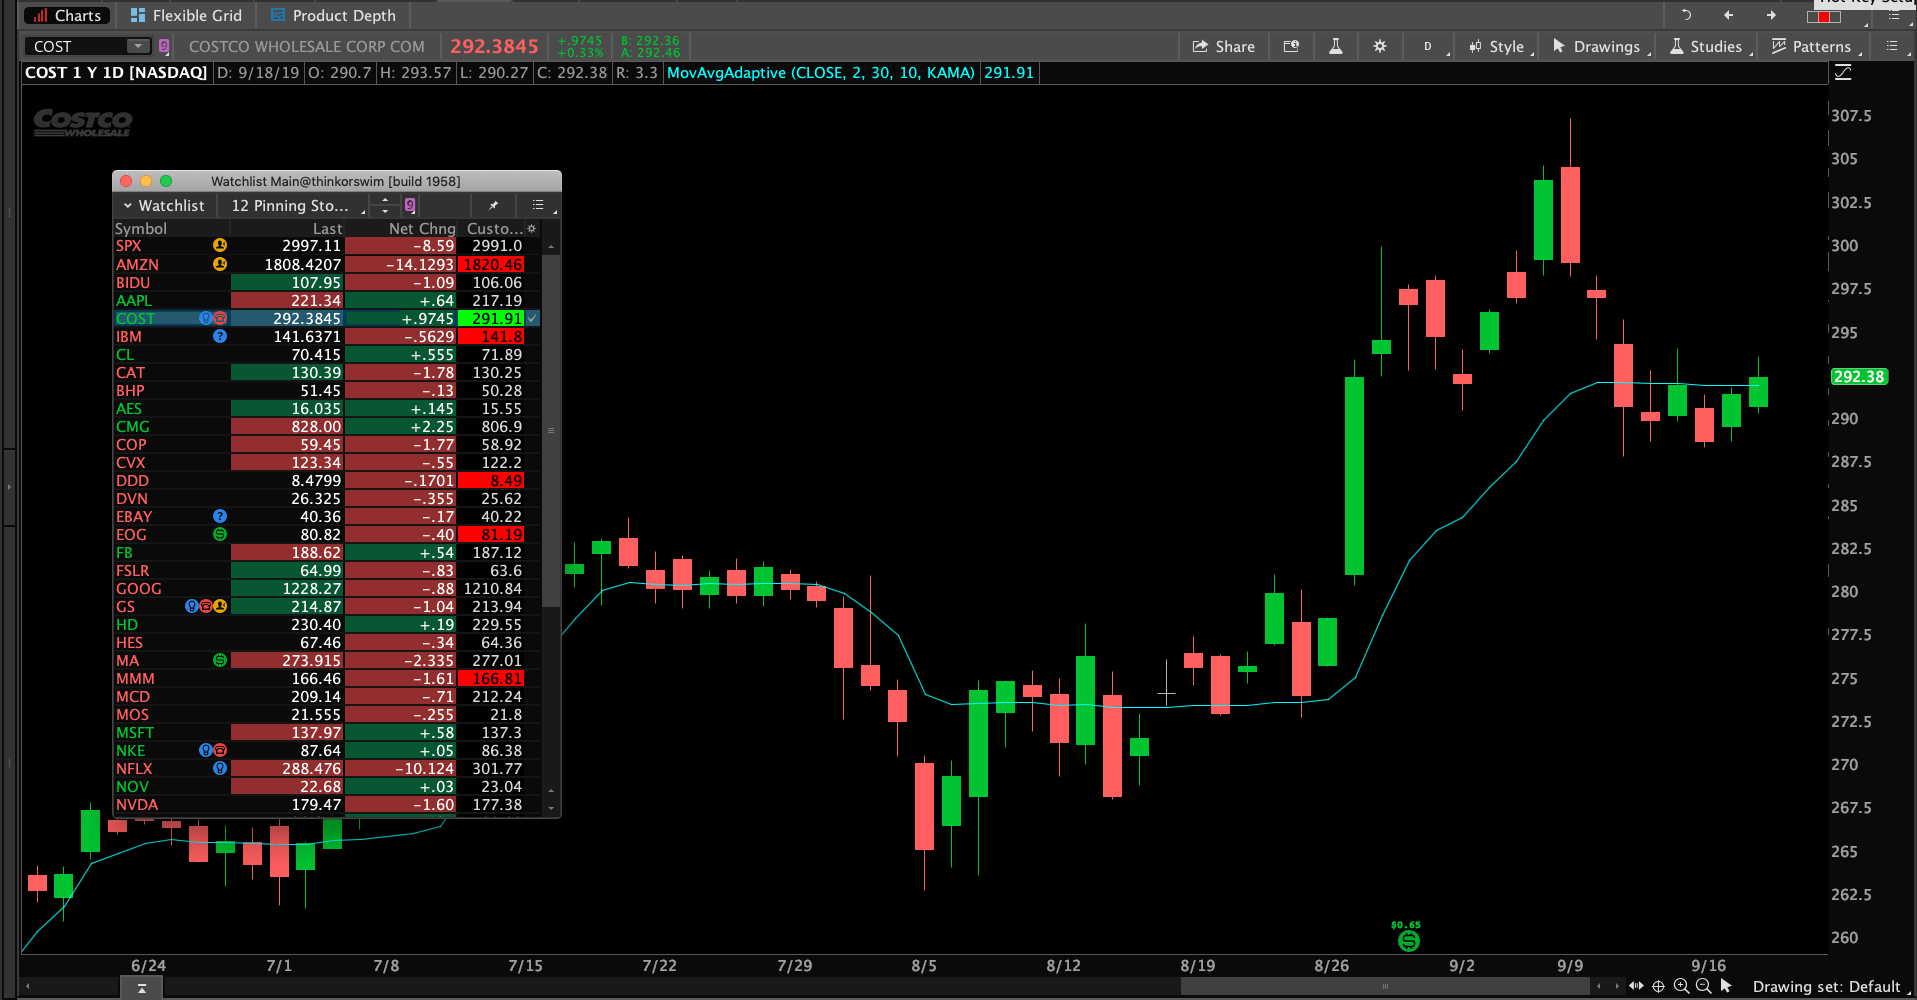
We can create the code for this however the values computed in the custom watchlist column do not exactly match those computed for the chart. So be sure to spend a lot of time testing this out before using it. Screenshot below shows the result.

Here is the code:

input price = close;
input fastLength = 2;
input slowLength = 30;
input effRatioLength = 10;
input mode = {default KAMA, AMA};
Assert(fastLength > 0, "'fast length' must be positive: " + fastLength);
Assert(slowLength > 0, "'slow length' must be positive: " + slowLength);
def direction;
def volatility;
def ER;
switch (mode) {
case KAMA:
direction = AbsValue(price - price[effRatioLength]);
volatility = Sum(AbsValue(price - price[1]), effRatioLength);
ER = if volatility != 0 then direction / volatility else 0;
case AMA:
direction = Double.NaN;
volatility = Double.NaN;
ER = AbsValue((price - Lowest(low, effRatioLength)) -
(Highest(high, effRatioLength) - price)) / (Highest(high,
effRatioLength) - Lowest(low, effRatioLength));
}
def FastSF = 2 / (fastLength + 1);
def SlowSF = 2 / (slowLength + 1);
def ScaledSF = ER * (FastSF - SlowSF) + SlowSF;
def AMA = CompoundValue(1, AMA[1] + Sqr(ScaledSF) * (price - AMA[1]),
price);
plot MovAvgAdaptive = AMA;
def crossAbove = close[1] < MovAvgAdaptive[1] and close > MovAvgAdaptive;
def crossBelow = close[1] > MovAvgAdaptive[1] and close < MovAvgAdaptive;
MovAvgAdaptive.AssignValueColor(if crossAbove or crossBelow then Color.BLACK else color.CURRENT);
AssignBackgroundColor(if crossAbove then Color.GREEN else if crossBelow then Color.RED else Color.CURRENT);

Attachments:
Marked as spam
Posted by (Questions: 37, Answers: 4084)
Answered on September 18, 2019 9:50 am
0
Thank you so much for your quick response.  I can not wait to see how this works.
( at September 18, 2019 12:13 pm)
0
This watchlist column works just as planned, the colored flags indicate when the AMA crosses and in what direction. I have tried to change the color of the other numbers that are listed, those are the ones above or below the crossover, to be the color of the direction they actually are above the crossover (GREEN) or below the crossover (Red) and I have failed. Could you give me additional code to add to the bottom that would keep the background colors as they are now with the crossover colored backgrounds, and modify only the color of the other numbers. This would give me red and green numbers with the CURRENT background and retain the crossAbove and crossBelow numbers as BLACK on the Green and Red backgrounds. This would enable me to look at the column and instantly know what stocks are above or below the AMA even when the Last price shows a different color. Thank you so much.
( at September 19, 2019 8:59 am)
0

Ok, so in reality what you are asking for is to set the color based on the position of price and AMA. You do not want the colors based on crossovers, which are signal bar events. You actually want the color based on price being above or below the AMA.

In order to modify the code you will delete these two lines:

def crossAbove = close[1] < MovAvgAdaptive[1] and close > MovAvgAdaptive;
def crossBelow = close[1] > MovAvgAdaptive[1] and close < MovAvgAdaptive;

Then you will change the last two lines of code as to this:

MovAvgAdaptive.AssignValueColor(Color.BLACK);
AssignBackgroundColor(if close > MovAvgAdaptive then Color.GREEN else Color.RED);

( at September 19, 2019 9:22 am)
0
Thank you for your very helpful additional information. I am sorry I was confusing to you on my needs. I actually wanted both of the ideas listed above to be visible in the same watch list column. I wanted a flagged crossover price that had both the background and the numbers appropriately colored and I wanted all the other numbers colored in the direction the price was going with a black background. This would enable me to quickly glance at the chart and instantly know what new stocks to view in a early breakout condition and to confirm whether or not the current price had changed direction from the trend direction. This would help me figure out the continuity of the trend. Thanks to your excellent coding, I was able to combine parts from both instructions to make this happen. This novice would never have even come close to doing this without your expert help. Thanks again.
( at September 20, 2019 12:55 pm)