Scan greater than custom percent of 52 week high or low


Category:
0
0

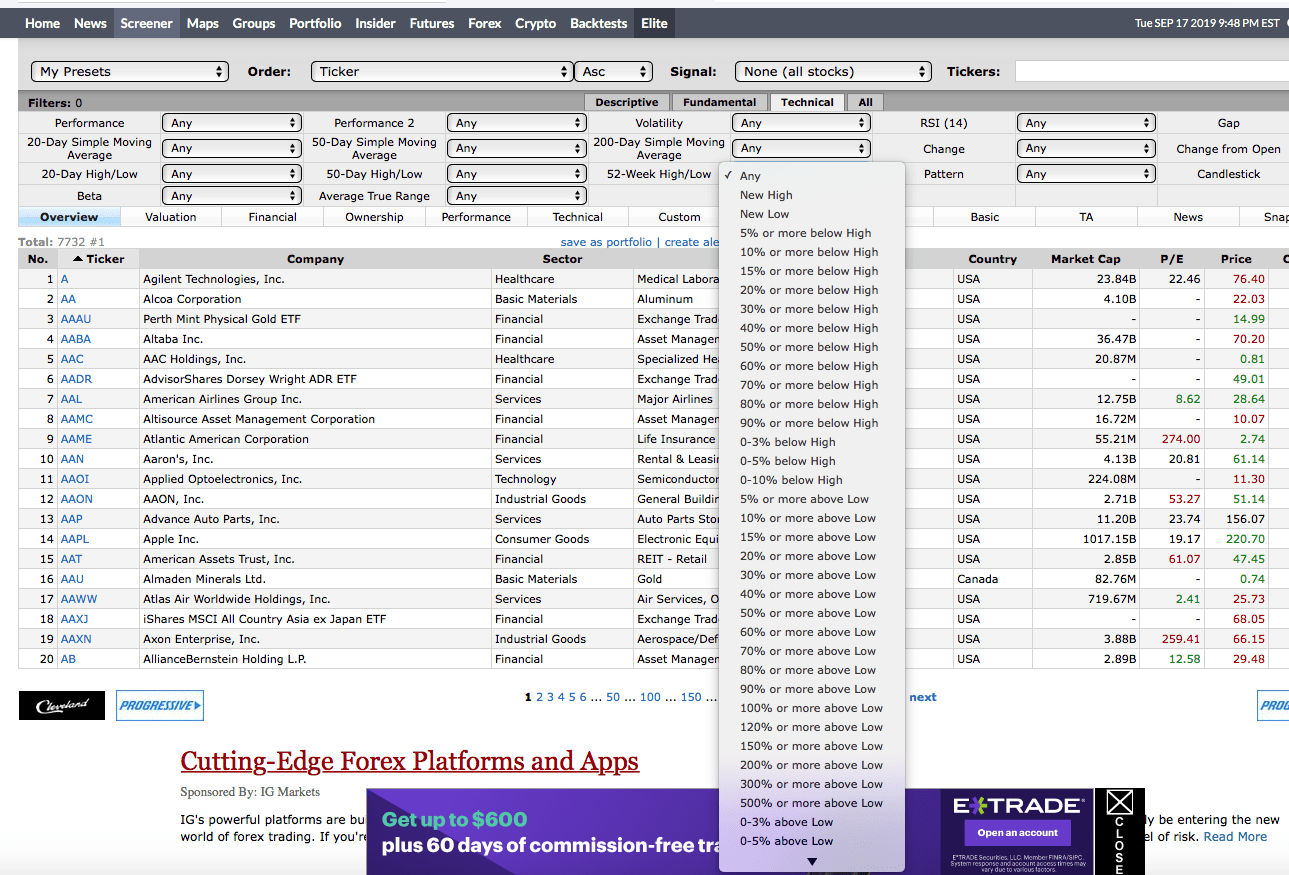
Hello,  I have gone through the lists here and could not find any script that can do the following.

Think or Swim Stock scan

  1. Scan for stocks which are 5% or more below 52 week high  (if  5% can be variable)
  2. Scan for stocks which are 5% or more above 52 week low   (if  5% can be variable)

I have attached a screen shot. Finviz has a similar search. I will really appreciate if you can assist. Thank you!

Attachments:
Marked as spam
Posted by (Questions: 1, Answers: 1)
Asked on September 17, 2019 6:58 pm
198 views
0

I am going to update the question title to correct the typo. You left out the word ”week”. Also changing the word ’within’ to ’greater than’. Within 5% percent would be 5% or less below 52 week high and 5% or less above 52 week low. You requested 5% or MORE.

( at September 18, 2019 9:25 am)
1
Private answer

# apply daily time frame to study filter
input percentFrom = 5.0;
def yearlyHigh = Highest(high, 252);
def yearlyLow = Lowest(low, 252);
# first scan is for 52 week high and second is for 52 week low
plot scan = close < yearlyHigh * (1 - (percentFrom * 0.01));
#plot scan = close > yearlyLow * (1 + (percentFrom * 0.01));

Marked as spam
Posted by (Questions: 37, Answers: 4087)
Answered on September 18, 2019 9:36 am
0
Thank you so much! I just had to make a small change since I was trying to capture all the stocks within 5% of 52 week high. I didn’t clarify that very well in my initial message. Really appreciate your help. Changed close yearlyHigh
( at September 18, 2019 8:44 pm)