| ♥ 0 |
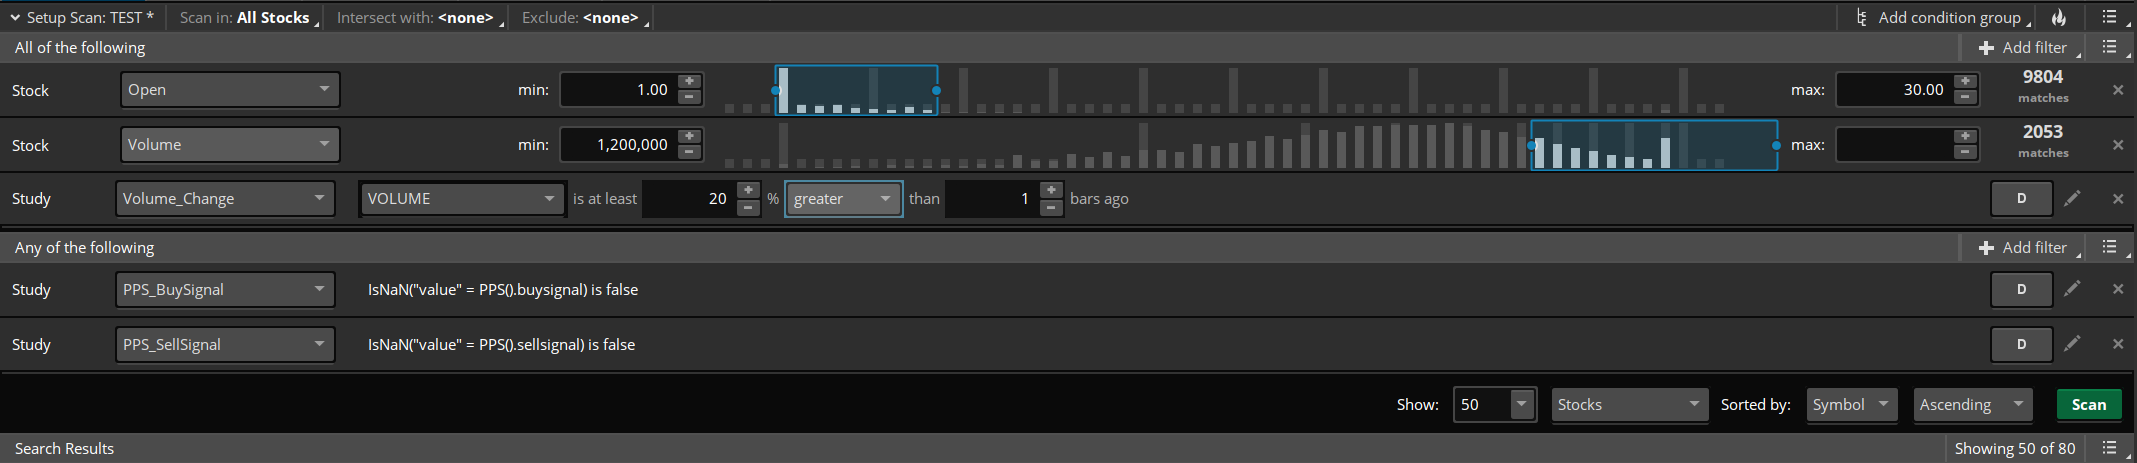
Hi Pete, I am trying to create a scan in which I am looking for to get alerts whenever the PPS signal generates on daily TF. I need your help in adding the following filters. 1- Daily range should be at least $1 or I can assign the range of my choice. 2-Candle in which a PPS signal generates is crossing above or below the highest high or lowest low of last 4 days. 3- I intend to assign an atleast 20 % volume change than one bar ago. I have selected the filter for that purpose. 4- I believe if I select “open” in the first filter I will have results as the PPS signal generates and If I select “last” I will have results upon daily candle close. Please correct me if I am wrong.
Attachments:
Marked as spam
Asked on December 5, 2020 12:35 pm
99 views
|
|
Private answer
Since you are requesting a scan I moved your post out of the "Chart Studies" topic and into the "Stock Scanners" topic. I also updated the title of the question to include the element you are trying to add. Before we get to the daily range filter let's make sure you understand how to scan for the PPS buy and sell signals: https://www.hahn-tech.com/ans/pps-and-pmc-custom-scanner/ From this post we learn the following is required to get the buy/sell signals from PPS to work as a scan:
For the daily range you merely compute the difference between the high and the low, then add a condition to check if that result is greater than whatever value you want to apply. In this case you want to apply a fixed value of $1. However a better approach would be to use a multiple of the daily ATR. This would allow the scan to adapt to any stock in the market, penny stocks all the way up to stocks like AMZN, GOOGL and CMG. But you did not specify that so I will leave that for another post.
That's your daily range filter. Add that as a new study filter in the condition group named "All of the following". Done. I see you had a couple of other filter criteria and I'm not sure if they are already included in your scan. So let's provide some code to facilitate the price pattern and volume condition filters:
Not sure exactly what you mean by "atleast 20 % volume change than one bar ago". So I will give you a scan that checks if volume of current bar is greater than the volume of the previous bar times 1.2. This is a 20% increase over the volume of the previous bar.
Final comments on your screenshot. I suggest you build two completely separate scans, one for the buy signals and the other for the sell signals. Trying to combine them both in the condition group named "Any of the following" is going to make it extremely complicated for you to add the other elements to your scan. Keep It Simple.... You get the idea. Marked as spam
Answered on December 5, 2020 2:49 pm
|