| ♥ 0 |
Hi Folks, I’m completely lost on this one. If anyone can lend some time to help, I’d really appreciate it. What I’m looking for: 1. For a green cloud to be displayed only when RSI (2) value is below 10. 2. For a red cloud to be displayed only when RSI (2) value is greater than 90. 3. For no cloud to be displayed when RSI (2) value is between 10-90. 4. These clouds should be displayed on price chart between the high and low of the candlestick. Is this possible? I currently have a bubble the shows on the chart when RSI values cross below a certain number, but that can be clunky so I’m thinking a cloud on price chart would look better. I’m trying to limit the clutter. I can then also take the RSI indicator off my screen since I have an RSI label. I’ve seen and can work through the EMA/SMA clouds, but this “if / then” type of cloud is beating me. Thank you for any help! -Wes
Marked as spam
|
|
Private answer
Great question and thanks for providing a detailed explanation and a title that immediately helps the rest of our viewers to know exactly what to expect when they click on your post. We have a similar solution posted here: https://www.hahn-tech.com/ans/add-fill-color-rsi-zero-line/ I will be using the code from that post as the basis for this solution. It only requires a few minor tweaks. However the solution to color the cloud based on the RSI being overbought or oversold may seem very complicated and confusing to some. The reason for this complication is that the AddCloud() statement does not permit us to conditionally set the colors. Which means we have to use two AddCloud() statements. One for the overbought condition and another for the oversold condition. For those interested in learning the technical details about the AddCloud() statement I will provide a link to the official Thinkorswim documentation: https://tlc.thinkorswim.com/center/reference/thinkScript/Functions/Look---Feel/AddCloud And if we want the end user to be able to adjust the colors we'll have to create some global colors. Details here: https://tlc.thinkorswim.com/center/reference/thinkScript/Functions/Look---Feel/DefineGlobalColor Now let's see what the full solution looks like:
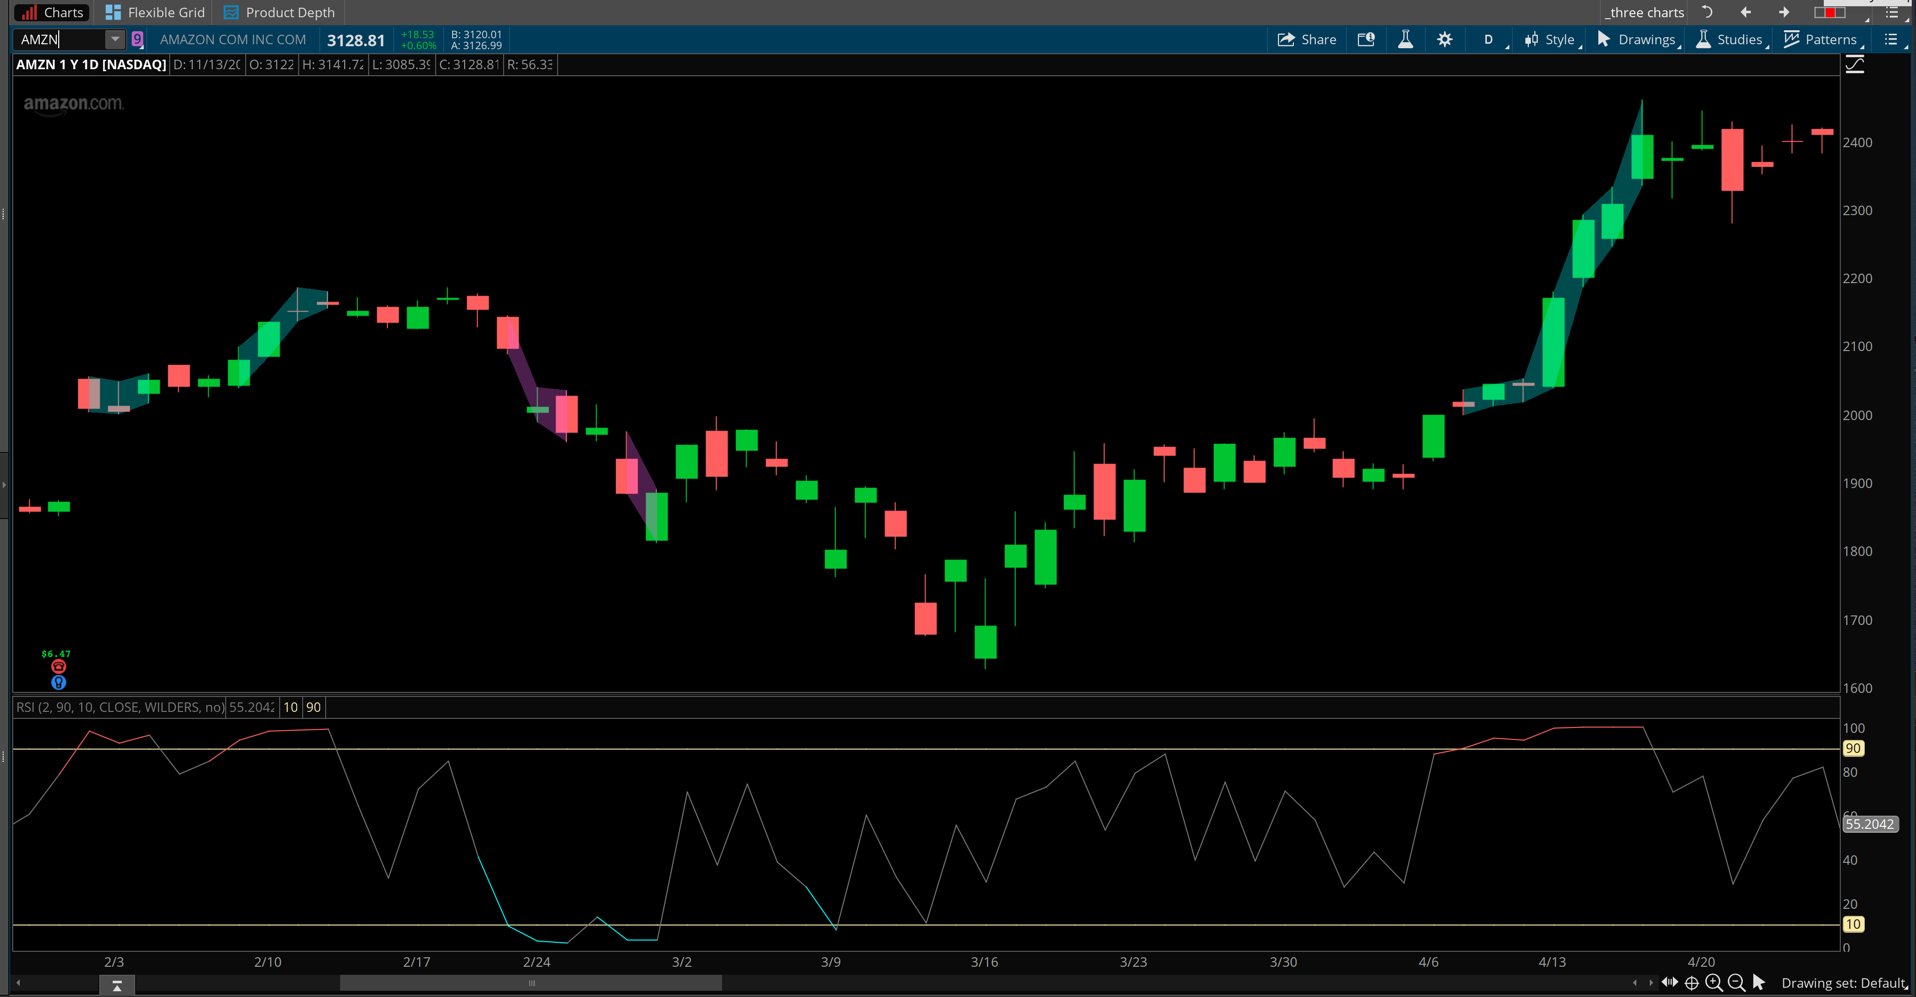
I have included a screenshot below to show the result. The default colors of dark green and dark red did not show up very well. So I adjusted the colors through the global settings to cyan and magenta. Clearly this needs a color scheme that makes it stand out from the colors of the candles. Attachments:
Marked as spam
Answered on November 14, 2020 12:09 pm
|