Adding color to fill area in the indicator


Category:
0
0

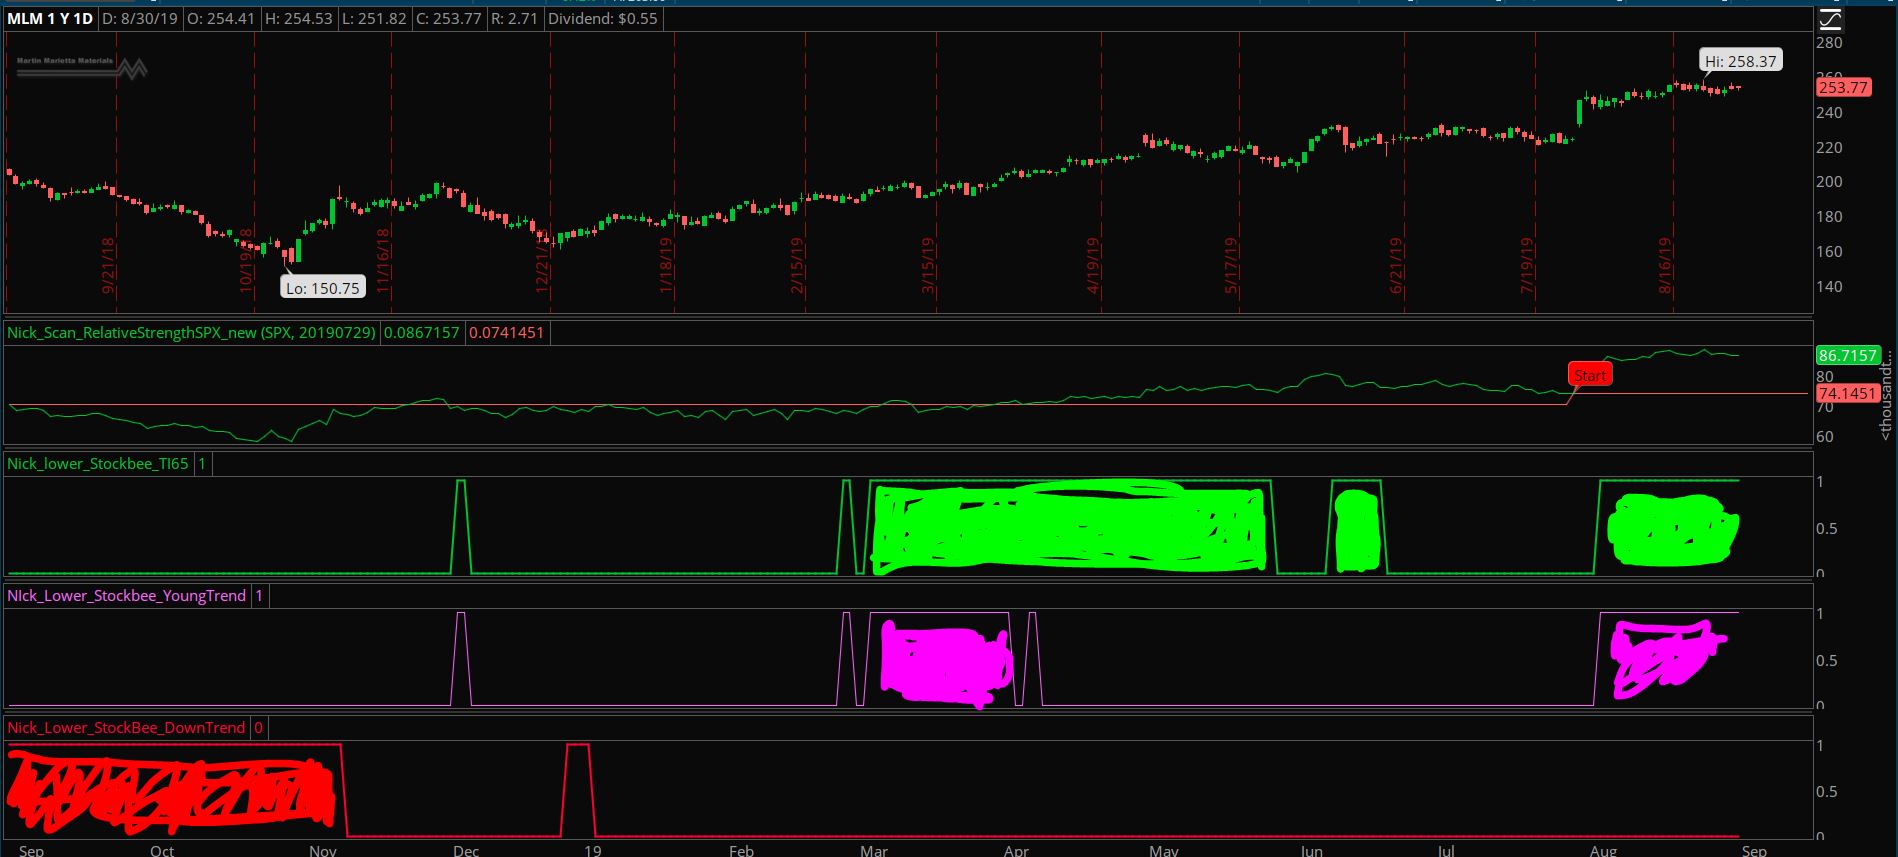
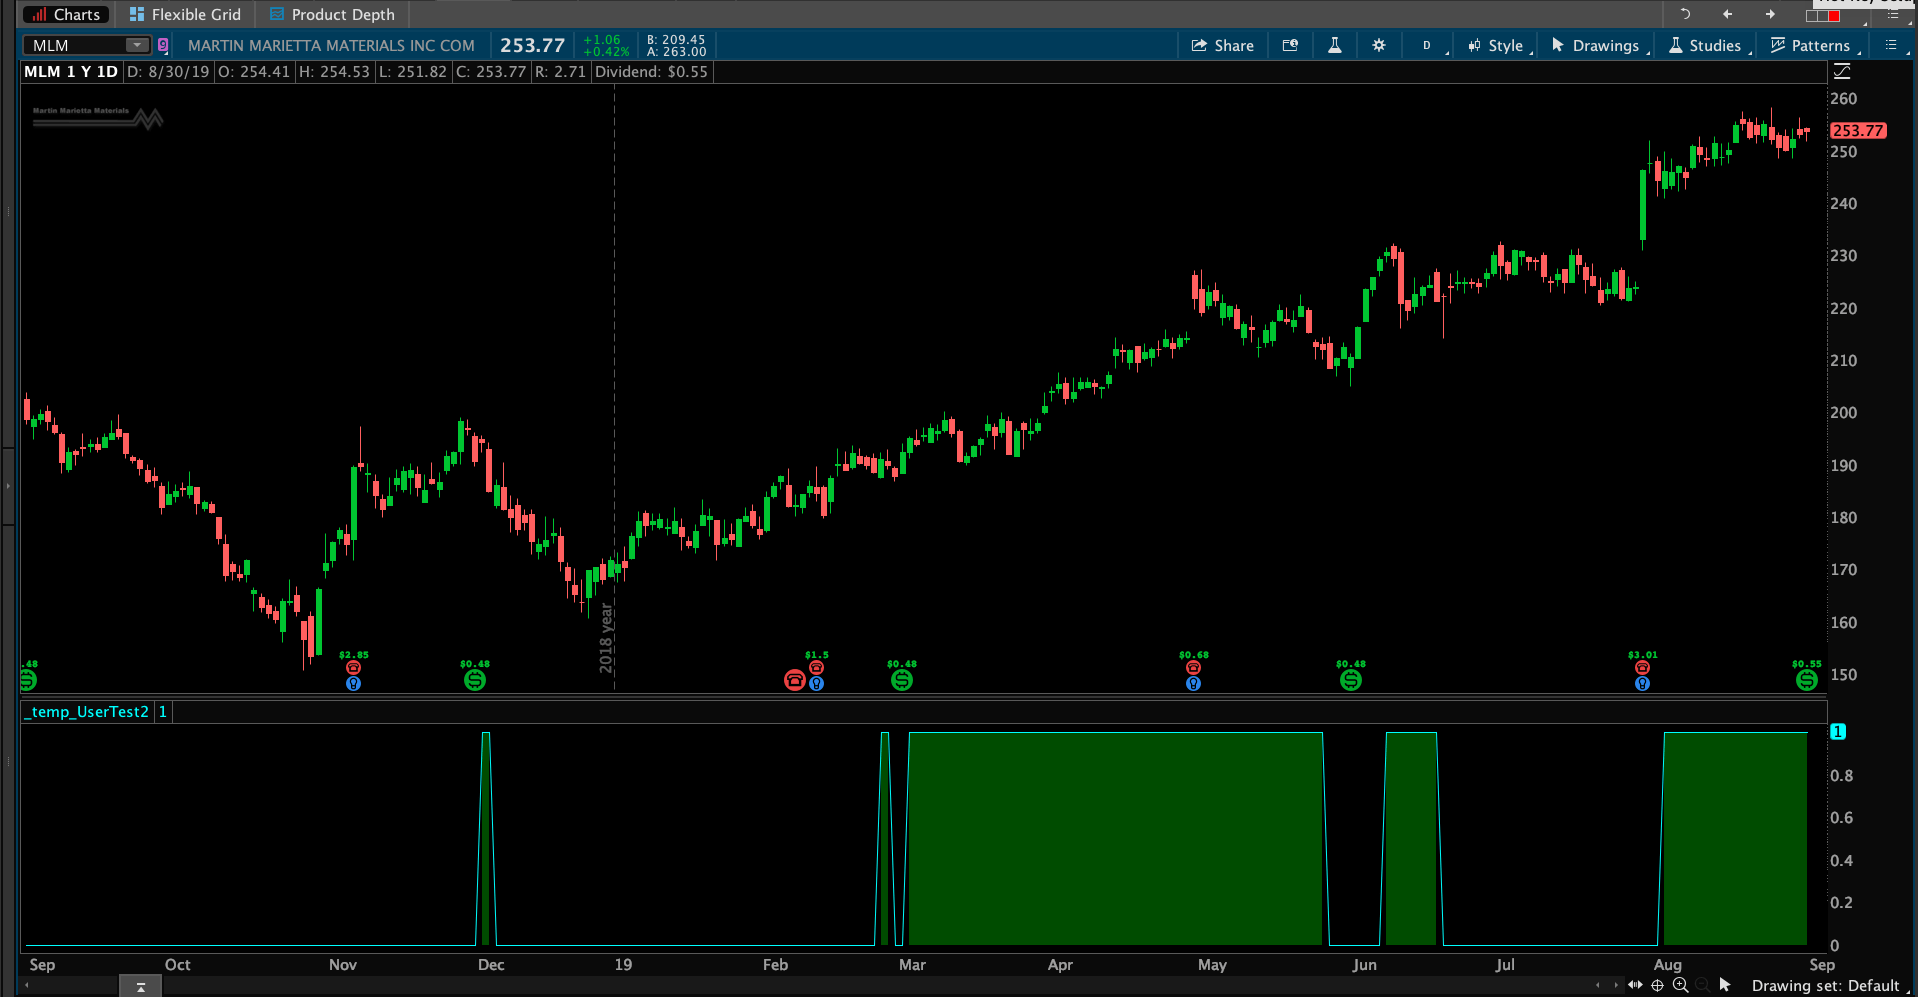
Hi Pete, these are the 3 codes that you have helped to convert from TC to TOS, i would like to learn how to fill the area within the indicator (shown in the pic) when the stock met each criteria. I tried to add cloud to fill the area but it does not work. Pls advise

def conditionOne = Average(close, 7) / Average(close, 65) >= 1.05;

plot x = conditionOne;

# fill Dark Green color

____________________

def conditionOne = Average(close, 7) / Average(close, 65) >= 1.05;

def conditionTwo = conditionOne and Average(close, 7)[25] / Average(close, 65)[25] <= 1.05;

Plot x = conditionTwo;

#fill lime Green color

________________________

def conditionOne = Average(close, 7) / Average(close, 65) <= 0.95;
plot x = conditionOne;

#fill red color

Thanks

Attachments:
Marked as spam
Posted by Nick Neo (Questions: 8, Answers: 15)
Asked on August 30, 2019 10:22 pm
162 views
0
Please note that I have moved your question out of the "Frequently Asked Questions" topic and into the "Chart Studies" topic. Please do not post in the "Frequently Asked Questions" topic.
(Pete Hahn at August 31, 2019 11:48 am)
0
Private answer

I'll do the first one for you and you can work out the rest. Screenshot below shows the result.

declare lower;
def conditionOne = Average(close, 7) / Average(close, 65) >= 1.05;
plot x = conditionOne;
AddCloud(if conditionOne then 1 else Double.NaN, if conditionOne then 0 else Double.NaN, Color.GREEN, Color.CURRENT);

Attachments:
Marked as spam
Posted by Pete Hahn (Questions: 37, Answers: 4153)
Answered on August 31, 2019 11:46 am