adding SMA5 to wilder RSI


Category:
0
0

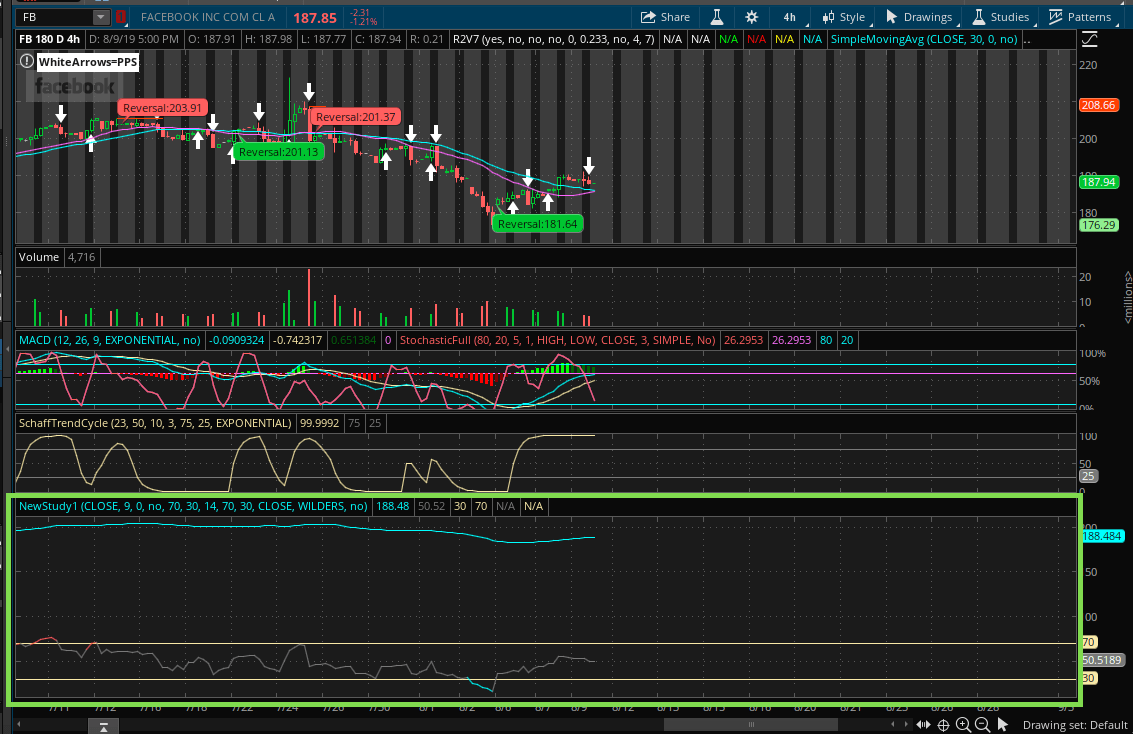
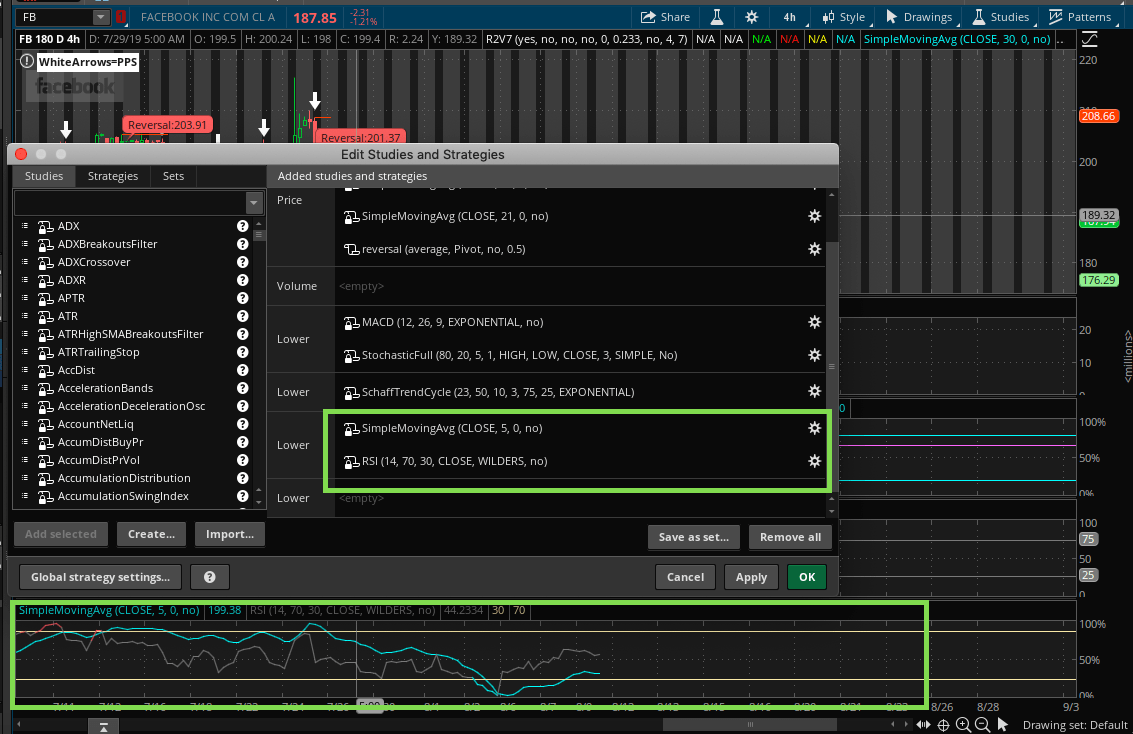
hi again pete.

i hope you are having a beautiful weekend.

what im trying to do is add a simple moving average (5) to the RSI. not the moving average of the RSI but the one from whatever stock is on the chart. i want it to show in such a way that i can look for whenever the rsi crosses up over the sma5.

this is what i got so far but it doesnt come out right (see screenshot 1). i just cant figure out why the sma5 does not draw inside the RSI but rather above it. also im aware that i could just add the 2 studies together (see screenshot 2) in one spot in the “edit studies” tab, but when i do it that way the position of the crossover moves, which makes it inaccurate to a degree:

input smaprice = close;
input smalength = 9;
input displace = 0;
input xshowBreakoutSignals = no;
input xover_Bought = 70;
input xover_Sold = 30;

plot SMA = Average(smaprice[-displace], smalength);
plot xUpSignal = smaprice crosses above SMA;
plot xDownSignal = smaprice crosses below SMA;

xUpSignal.SetHiding(!xshowBreakoutSignals);
xDownSignal.SetHiding(!xshowBreakoutSignals);

SMA.SetDefaultColor(GetColor(1));
xUpSignal.SetDefaultColor(Color.UPTICK);
xUpSignal.SetPaintingStrategy(PaintingStrategy.BOOLEAN_ARROW_UP);
xDownSignal.SetDefaultColor(Color.DOWNTICK);
xDownSignal.SetPaintingStrategy(PaintingStrategy.BOOLEAN_ARROW_DOWN);

input length = 14;
input over_Bought = 70;
input over_Sold = 30;
input price = close;
input averageType = AverageType.WILDERS;
input showBreakoutSignals = no;

def NetChgAvg = MovingAverage(averageType, price – price[1], length);
def TotChgAvg = MovingAverage(averageType, AbsValue(price – price[1]), length);
def ChgRatio = if TotChgAvg != 0 then NetChgAvg / TotChgAvg else 0;

plot RSI = 50 * (ChgRatio + 1);
plot OverSold = over_Sold;
plot OverBought = over_Bought;
plot UpSignal = if RSI crosses above OverSold then OverSold else Double.NaN;
plot DownSignal = if RSI crosses below OverBought then OverBought else Double.NaN;

RSI.DefineColor(“OverBought”, GetColor(5));
RSI.DefineColor(“Normal”, GetColor(7));
RSI.DefineColor(“OverSold”, GetColor(1));
RSI.AssignValueColor(if RSI > over_Bought then RSI.color(“OverBought”) else if RSI < over_Sold then RSI.color(“OverSold”) else RSI.color(“Normal”));
OverSold.SetDefaultColor(GetColor(8));
OverBought.SetDefaultColor(GetColor(8));

thank you for your time!

ru

Attachments:
RESOLVED
Marked as spam
Posted by (Questions: 6, Answers: 5)
Asked on August 10, 2019 1:12 pm
106 views
0
Private answer

I have a very simple answer. What you are trying to accomplish is impossible. I have run across folks trying to do this before. A simple moving average based on the price of the stock is not in any way compatible with the RSI. They are like water and oil. They don't go together at all.

Marked as spam
Posted by (Questions: 37, Answers: 4087)
Answered on August 10, 2019 6:09 pm
0
thank you anyway. makes sense. it was worth a shot, if anyone would have known how to do it, it would have been you.
( at August 10, 2019 6:29 pm)