3 vertical lines on chart for pre/post earnngs


Category:
0
0

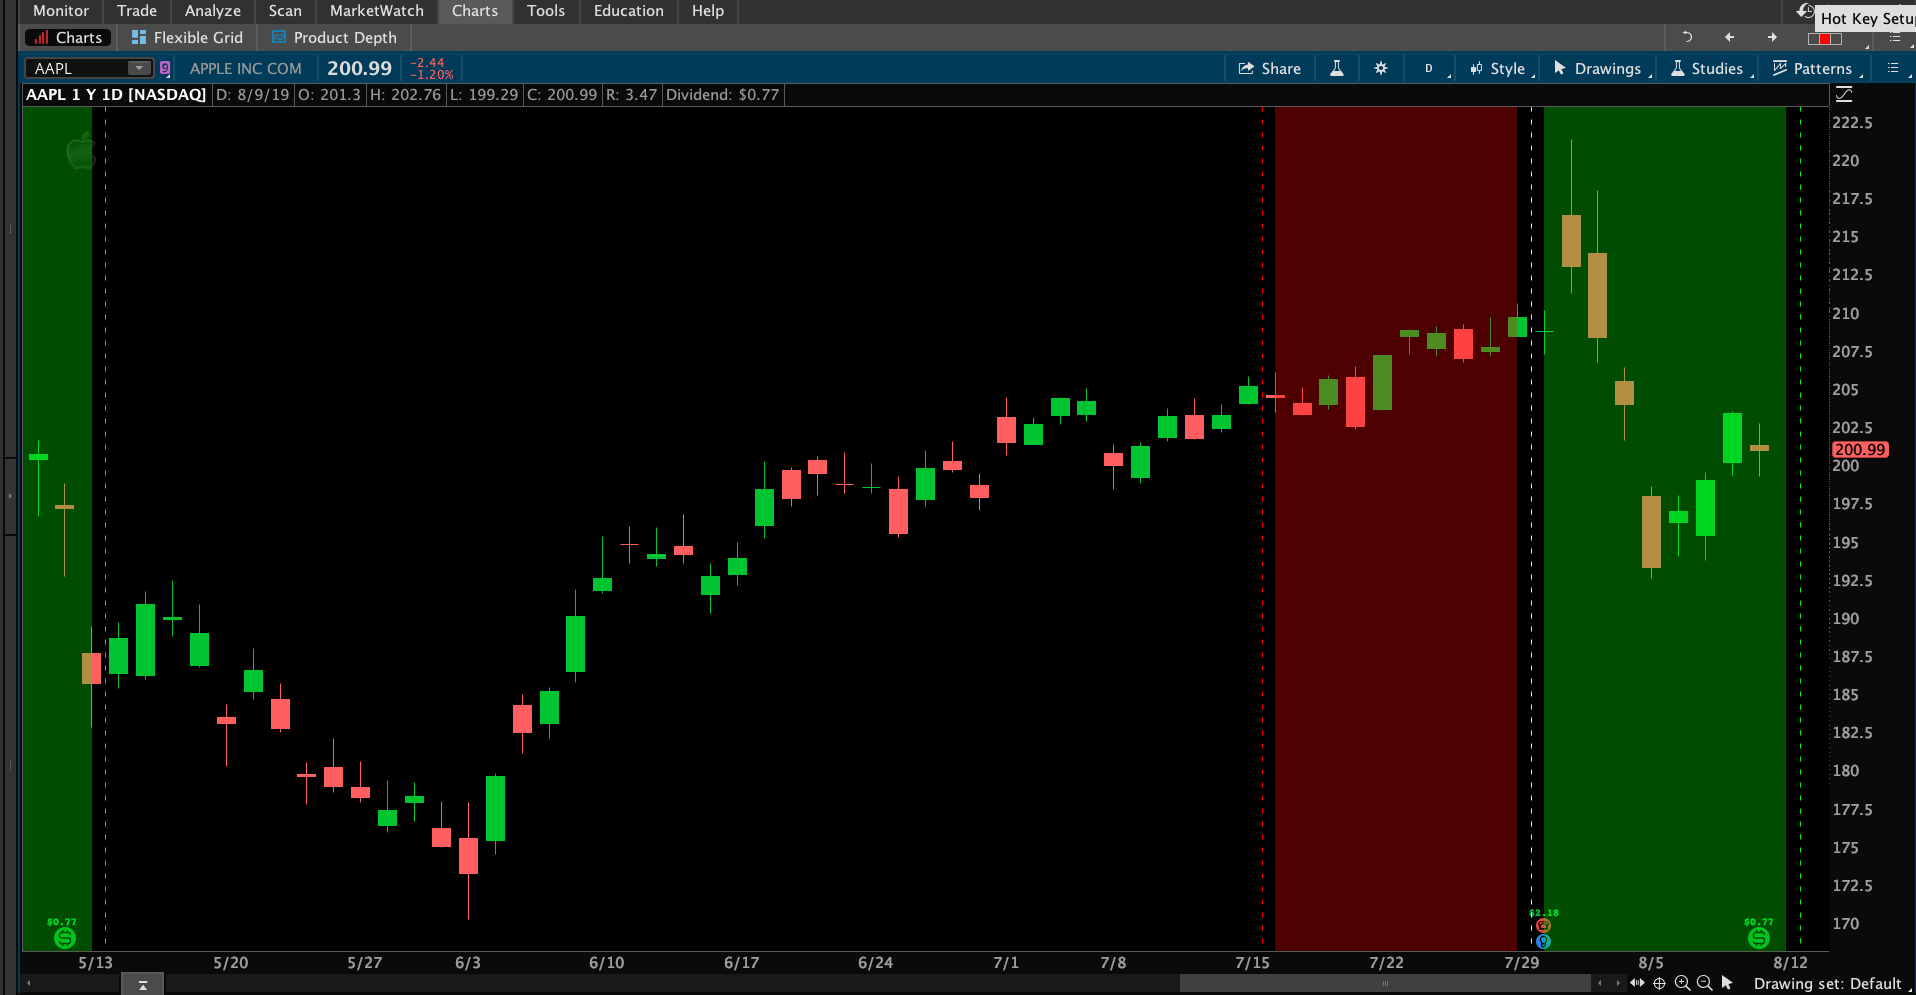
Pete

Is is possible to add 3 vertical for around earnings…1st line is 10 day prior to earnings…2nd is on earnings day and the 3 is 10 days after earnings….Also if we could make the columns as a cloud that would be great….I’ve included an example of what I’m looking for….

Thanks

Attachments:
Marked as spam
Posted by (Questions: 49, Answers: 42)
Asked on August 10, 2019 3:13 pm
1526 views
0
Hi Pete, Is there a way to show the date/time of the earnings on the line and also to adjust the line?  1) I wanted to use the above code on an hourly time framed chart so is there a way to shade the entire day of earnings instead of just a thin line on the actual day/time of earnings?  2) I copied the above and I was able to change the color but is there a way to make it a solid thick line instead of a dashed line?   Thank you in advance.
( at October 24, 2020 9:47 pm)
0
The text label of the vertical line can be set from within the code. The date/time data is not easy to derive because Thinkorswim language does not include any date/time parsing function. 1) It may be possible to do this using "AddCloud()" function 2) In my answer to this question I provided a link to the language reference for the "AddVerticalLine()" function.
( at October 25, 2020 8:34 am)
0
Private answer

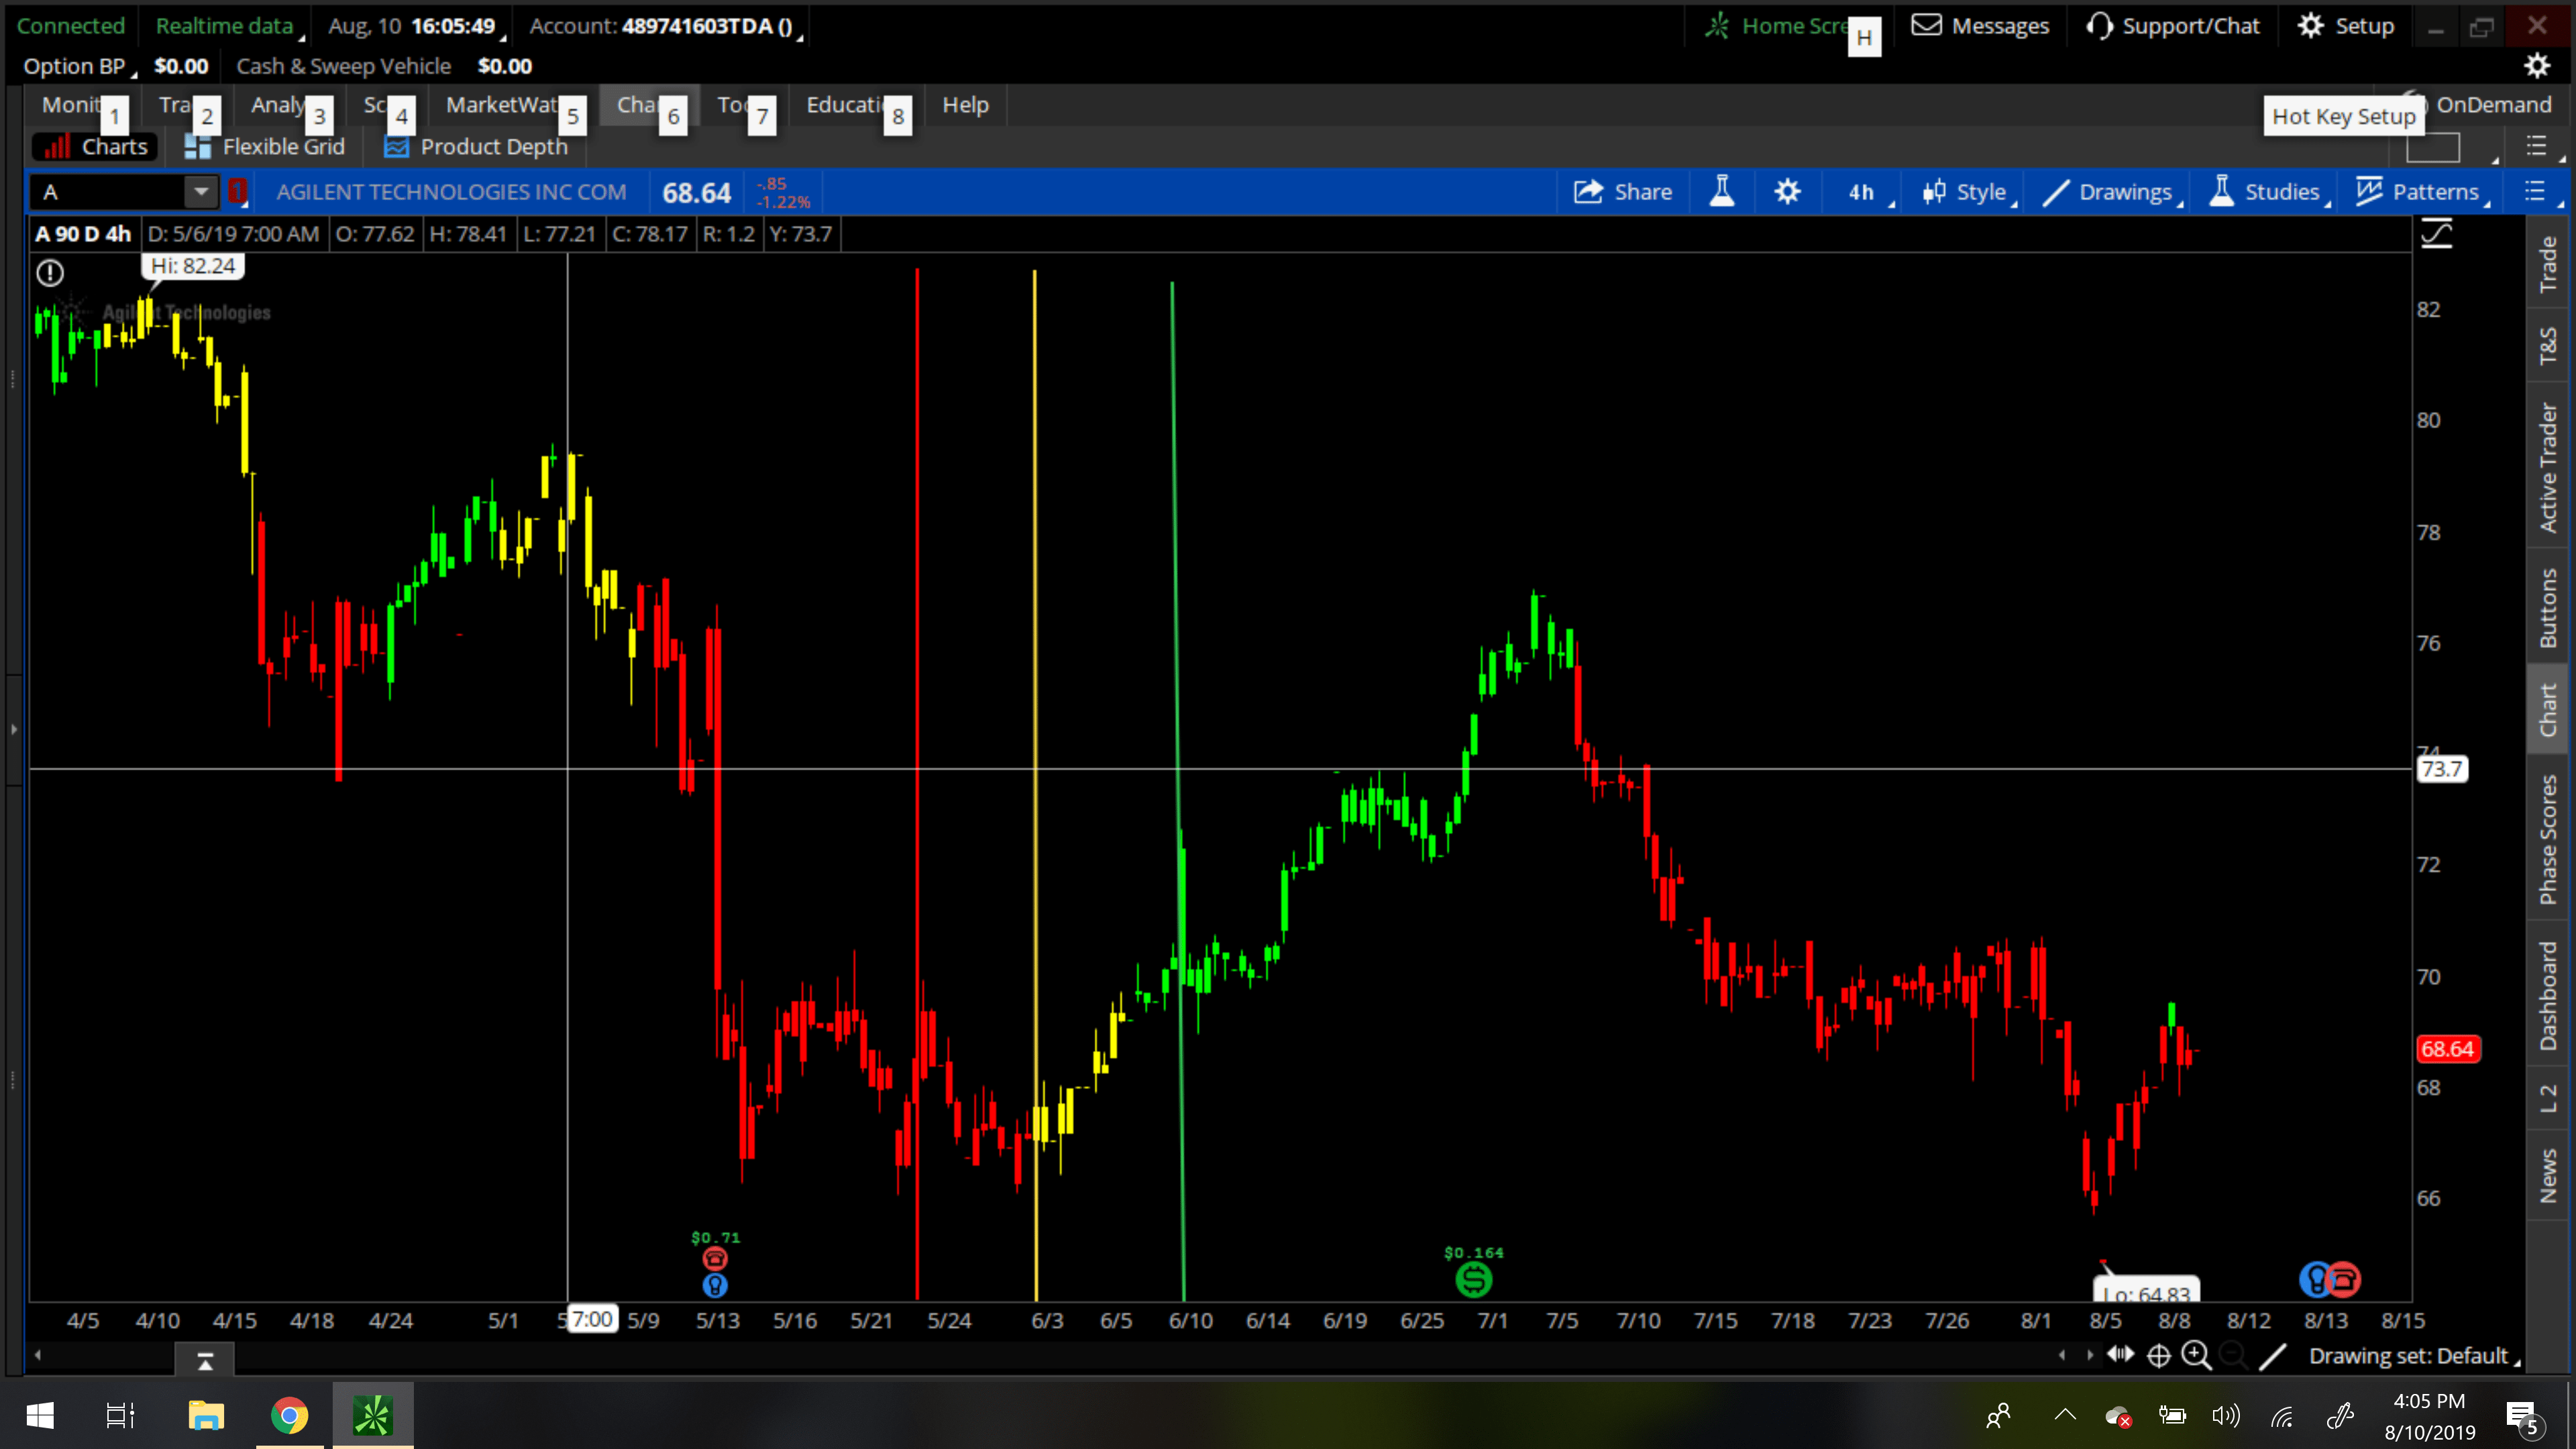
I noticed that in your example screenshot those vertical lines are not drawn according to your description. You requested a vertical line 10 days before earnings and another one on the day of earnings and a third one 10 days after earnings. So I am ignoring the screenshot and writing this code based on what you requested.

Details on how to write code based on earnings events are provided in the language reference for Thinkorswim. The function name is HasEarnings()

http://tlc.thinkorswim.com/center/reference/thinkScript/Functions/Corporate-Actions/HasEarnings.html

In order to draw vertical lines on the chart we will making use of the function named AddVerticalLine():

http://tlc.thinkorswim.com/center/reference/thinkScript/Functions/Look---Feel/AddVerticalLine.html

AddVerticalLine(HasEarnings()[-10], "", Color.RED);
AddVerticalLine(HasEarnings(), "", Color.YELLOW);
AddVerticalLine(HasEarnings()[10], "", Color.GREEN);

You also asked about shading the areas between the lines. That is handled by a function named AddCloud():

http://tlc.thinkorswim.com/center/reference/thinkScript/Functions/Look---Feel/AddCloud.html

This requires a bit of a trick to get the area before earnings to be shaded. But I figured it out.

def beforeEarnings = HasEarnings()[-10];
AddCloud(if Highest(beforeEarnings, 10) > 0 then Double.POSITIVE_INFINITY else Double.NaN, if Highest(beforeEarnings, 10) > 0 then Double.NEGATIVE_INFINITY else Double.NaN, Color.RED, Color.CURRENT);
AddCloud(if Highest(HasEarnings(), 10) > 0 then Double.POSITIVE_INFINITY else Double.NaN, if Highest(HasEarnings(), 10) > 0 then Double.NEGATIVE_INFINITY else Double.NaN, Color.GREEN, Color.CURRENT);

Screenshot below shows the result.

Attachments:
Marked as spam
Posted by (Questions: 37, Answers: 4084)
Answered on August 10, 2019 6:39 pm
0
This is perfect....Thanks
( at August 10, 2019 7:16 pm)
0
Could you add to this and have an input selection that allowed you to choose how many dates prior to earnings and how many days after earnings? Either type or drop down menu of days. 
( at August 11, 2019 8:14 pm)
0
It's simple enough just to modify the code manually. Just change the number 10 to some other value. Everywhere the number 10 appears in the code, just change it to some other value.
( at August 12, 2019 6:50 am)
0
Hi, sorry to revive an old post, but I have a question on this. Is there a way to color code the vertical clouds (green, yellow, red) based on the % move of the stock between dates in the past? I am wanting to incorporate this into my run into earnings chart set up. For example, starting 21 days prior to earnings to the earnings date, add a vertical cloud that is green if the stock moved up over 5%, yellow if it was below 5%, and red if it was a negative return. Id like to add a cloud starting at 21 days, 14 days, and 7 days pre-earnings with a look back period of about 2 years worth of data. I'd also like to add a chart label with historical data of the average move 21, 14, and 7 days prior to earnings. Sorry if this is in the wrong spot. I appreciate any help! Thanks!
( at April 10, 2021 2:37 pm)
0
Always glad to know folks are reading the older posts before posting a new question so there is no reason to apologize. I understand the changes are you describing but there is no way I can complete that in the brief 15 min I allocate to each free solution I provide in the Q&A Forum.
( at April 10, 2021 3:03 pm)
0
Thanks for the response Pete. Is there any material you could point me to that would give me the info I need to complete this myself, or is it too complex? If I had to go with one over the other, Id say just coding the labels with the historical data would be preferable.
( at April 10, 2021 9:10 pm)
0
The complexity you are trying to achieve is beyond the level of anything that has been previously posted in this forum. I have no further resources to recommend. I can do it. But I cannot do it in under 15 minutes.
( at April 10, 2021 9:43 pm)