ADX of an higher time frame (MTF)


Category:
0
0

I am working on a study in which I need the ADX(14) of an higher time frame.

I was thinking of using the “aggregationperiod” function, but ADX seems to be a very automated function/study.

I can’t figure where I should specify the aggregationperiod within ADX function.


ADX study goes as follow:

declare lower;


input length = 14;

input averageType = AverageType.WILDERS;


plot ADX = DMI(length, averageType).ADX;

ADX.setDefaultColor(GetColor(5));

RESOLVED
Marked as spam
Posted by (Questions: 1, Answers: 1)
Asked on April 16, 2018 7:24 pm
678 views
0

Your first issue is that you are trying to reference the study plot instead of using the entire code. When folks run into trouble, it’s very often due to this very issue. Stop referencing studies and use the entire code. From the ADX we find that it is actually referencing a study named “DMI”. So you are trying to reference a study, that is referencing another study. See how quickly things can get tangled up?

So we need to use the entire code of the DMI study…. but you didn’t tell me which aggregation period you wanted to use???

( at April 16, 2018 8:06 pm)
0

Thanks for your answer. It is somehow what I was trying to achieve: I looked how ADX is calculated in my Wilders book! To then saw your comment and pay more attention to your code for your ADX in watchlist (where ADX calculation is break down).
So in the end, it was about having a more detail ADX calculation so that I can define the aggregationperiod for: high, low, close, …
To answer your curiosity/question. I need to evaluate ADX in different higher time frames, but whithin the same indicator which is already looking for other things in a smaller time frame.
I don’t want to do it through the watchlist, otherwise I will have too many columns in the watchlist.

Thanks again for your answer.

( at April 17, 2018 7:17 am)
0
Private answer

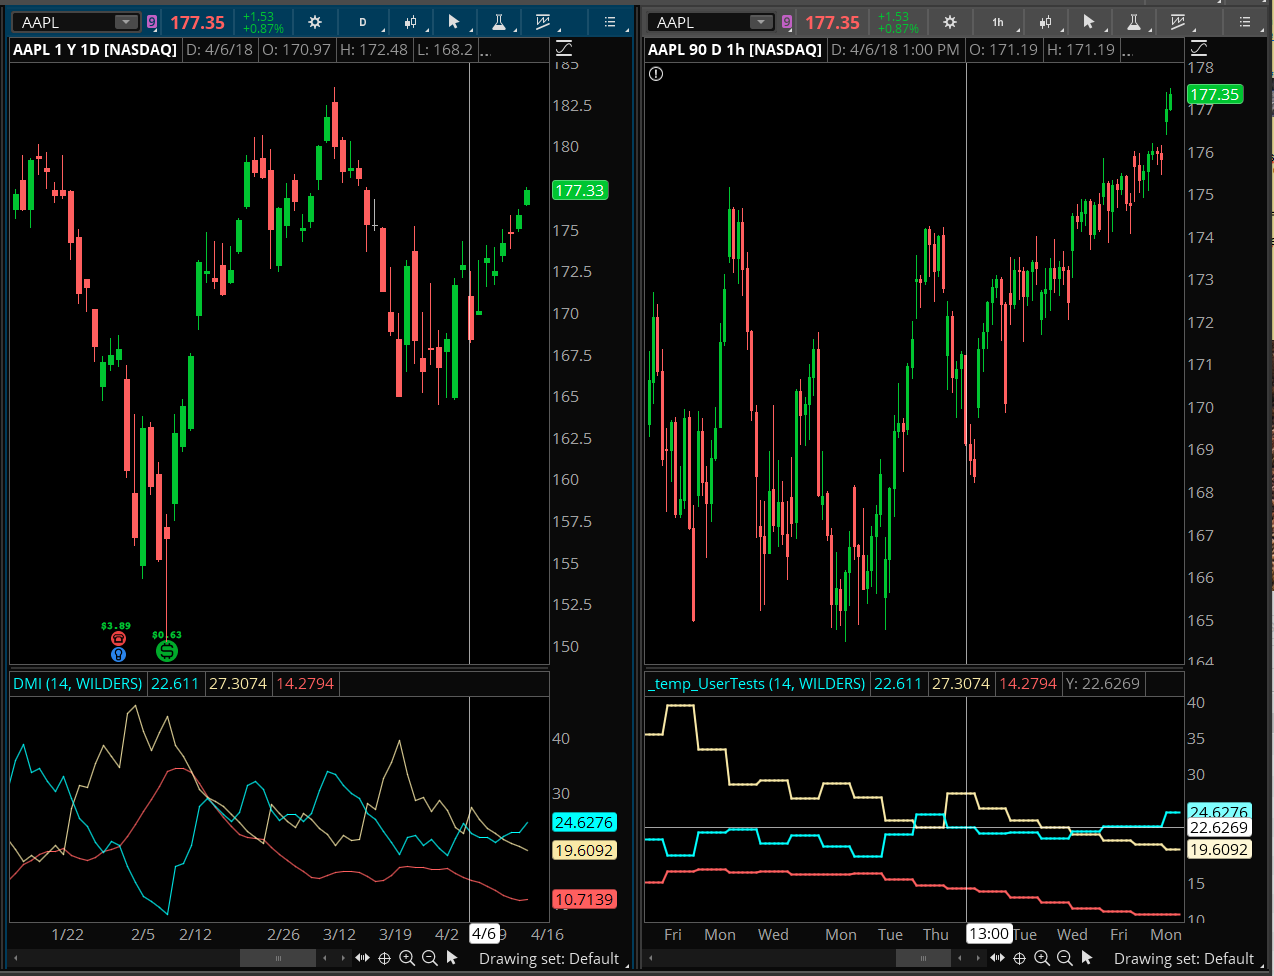
After Joey provided a bit more detail, I have a solution (although he still does not provide the higher time frame requested).

Here is the full DMI indicator modified to read from Daily time frame. Screenshot below shows side-by-side charts. Daily on the left and hourly on the right. The chart on the right contains this code and plots the daily DMI on the hourly chart.

declare lower;
input length = 14;
input averageType = AverageType.WILDERS;
def hiDiff = high(period = AggregationPeriod.DAY) - high(period = AggregationPeriod.DAY)[1];
def loDiff = low(period = AggregationPeriod.DAY) [1] - low(period = AggregationPeriod.DAY) ;
def plusDM = if hiDiff > loDiff and hiDiff > 0 then hiDiff else 0;
def minusDM = if loDiff > hiDiff and loDiff > 0 then loDiff else 0;
def ATR = MovingAverage(averageType, TrueRange(high(period = AggregationPeriod.DAY), close(period = AggregationPeriod.DAY) , low(period = AggregationPeriod.DAY) ), length);
plot "DI+" = 100 * MovingAverage(averageType, plusDM, length) / ATR;
plot "DI-" = 100 * MovingAverage(averageType, minusDM, length) / ATR;
def DX = if ("DI+" + "DI-" > 0) then 100 * AbsValue("DI+" - "DI-") / ("DI+" + "DI-") else 0;
plot ADX = MovingAverage(averageType, DX, length);
"DI+".SetDefaultColor(GetColor(1));
"DI-".SetDefaultColor(GetColor(8));
ADX.SetDefaultColor(GetColor(5));

Attachments:
Marked as spam
Posted by (Questions: 37, Answers: 4079)
Answered on April 17, 2018 7:29 am
0
Something weird… When I run the study in a 1 min chart, to return the ADX(14) on the 15 min time frame. I get the same value on the 1 min study than the ADX on the 15min. But if I copy and paste the ThinkScript into a script for a watchlist, The code returns a different value in the watchlist than the ADX on the 15 min chart. I was wondering “how come”? The watchlist code is set for 1min (just like in the study). Both in the watchlist and on the charts price is set in “Mark” (for Forex application). (I used exactly what you provide above to solve the ADX issue) Here is the code for the ADX that I use… # HF = 15 min input length_15min = 14; def hiDiff_15min = high(period = aggregationPeriod.FIFTEEN_MIN) – high(period = aggregationPeriod.FIFTEEN_MIN)[1]; def loDiff_15min = low(period = aggregationPeriod.FIFTEEN_MIN)[1] – low(period = aggregationPeriod.FIFTEEN_MIN); def plusDM_15min = if hiDiff_15min > loDiff_15min and hiDiff_15min > 0 then hiDiff_15min else 0; def minusDM_15min = if loDiff_15min > hiDiff_15min and loDiff_15min > 0 then loDiff_15min else 0; def ATR_15min = MovingAverage(AverageType.WILDERS, TrueRange(high(period = aggregationPeriod.FIFTEEN_MIN), close(period = aggregationPeriod.FIFTEEN_MIN), low(period = aggregationPeriod.FIFTEEN_MIN)), length_15min); def diPlus_15min = 100 * MovingAverage(AverageType.WILDERS, plusDM_15min, length_15min) / ATR_15min; def diMinus_15min = 100 * MovingAverage(AverageType.WILDERS, minusDM_15min, length_15min) / ATR_15min; def DX_15min = if (diPlus_15min + diMinus_15min > 0) then 100 * AbsValue(diPlus_15min – diMinus_15min) / (diPlus_15min + diMinus_15min) else 0; plot ADX_15min = MovingAverage(averageType.WILDERS, DX_15min, length_15min);
( at April 17, 2018 7:48 am)
0

You cannot use secondary aggregation periods in a watchlist. Each watchlist column may only contain the time frame to which it is assigned. I would have mentioned this in my answer except for your statement: “I don’t want to do it through the watchlist, otherwise I will have too many columns in the watchlist.” It seemed pretty clear from this statement that you were not trying to apply this to a watchlist. Especially when taking into account this was posted in the Chart Studies topic.

( at April 17, 2018 7:58 am)
0
Thanks (that makes sense/explain) If you would like to achieve the following, how would you proceed (main approach) – Highlight a Forex pair time frames (5min, 15min, 1hr, or 4hrs) in the watchlist (1column per time frames) Highlight if criteria is meet (for example, let’s pick the 5min) – TSI above a certain value on the 1min – And TSI above a certain value on the 5min – And ADX above a certain value on the 15min Is there a better way than having 3 columns in a row (1 for each criteria above) for the 5min, then 3 other columns in a row for the 15min,… (this would lead to adding 12 columns in the watchlist)?
( at April 17, 2018 8:37 am)
0

Unfortunately, there is no other way. Each time frame must be it’s own column in the watchlist. Just like I have laid out in the various videos I have published on custom watchlists.

Have you seen the one titled “Thinkorswim ADX DMI Watchlist”: https://www.hahn-tech.com/thinkorswim-adx-dmi-watchlist/

This shows that you can vary the color of the background and also vary the color of the text. This enables one to communicate two separate states in the same column, although we are still forced to use one time frame per column.

( at April 17, 2018 8:49 am)
0

Yes I did. Thanks a lot for your help.

( at April 17, 2018 9:02 am)