This is a great question. But the full solution is beyond the scope of what I can provide for no charge in the Q&A forum. I only get 15 min for each solution and this one is already over that limit.
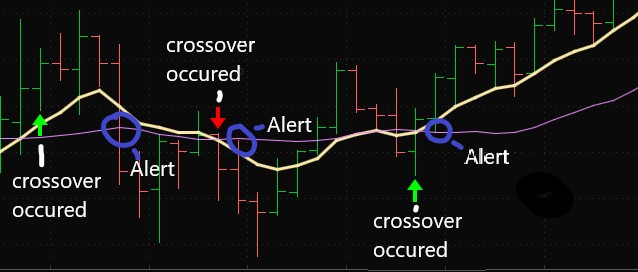
Great screenshot, but please don't be so stingy next time. Include the full view of the chart so we can see the selected ticker symbol, time frame, price range and date/time range. You have omitted nearly all of the most essential data points by forcing us to examine and elephant through a pinhole.
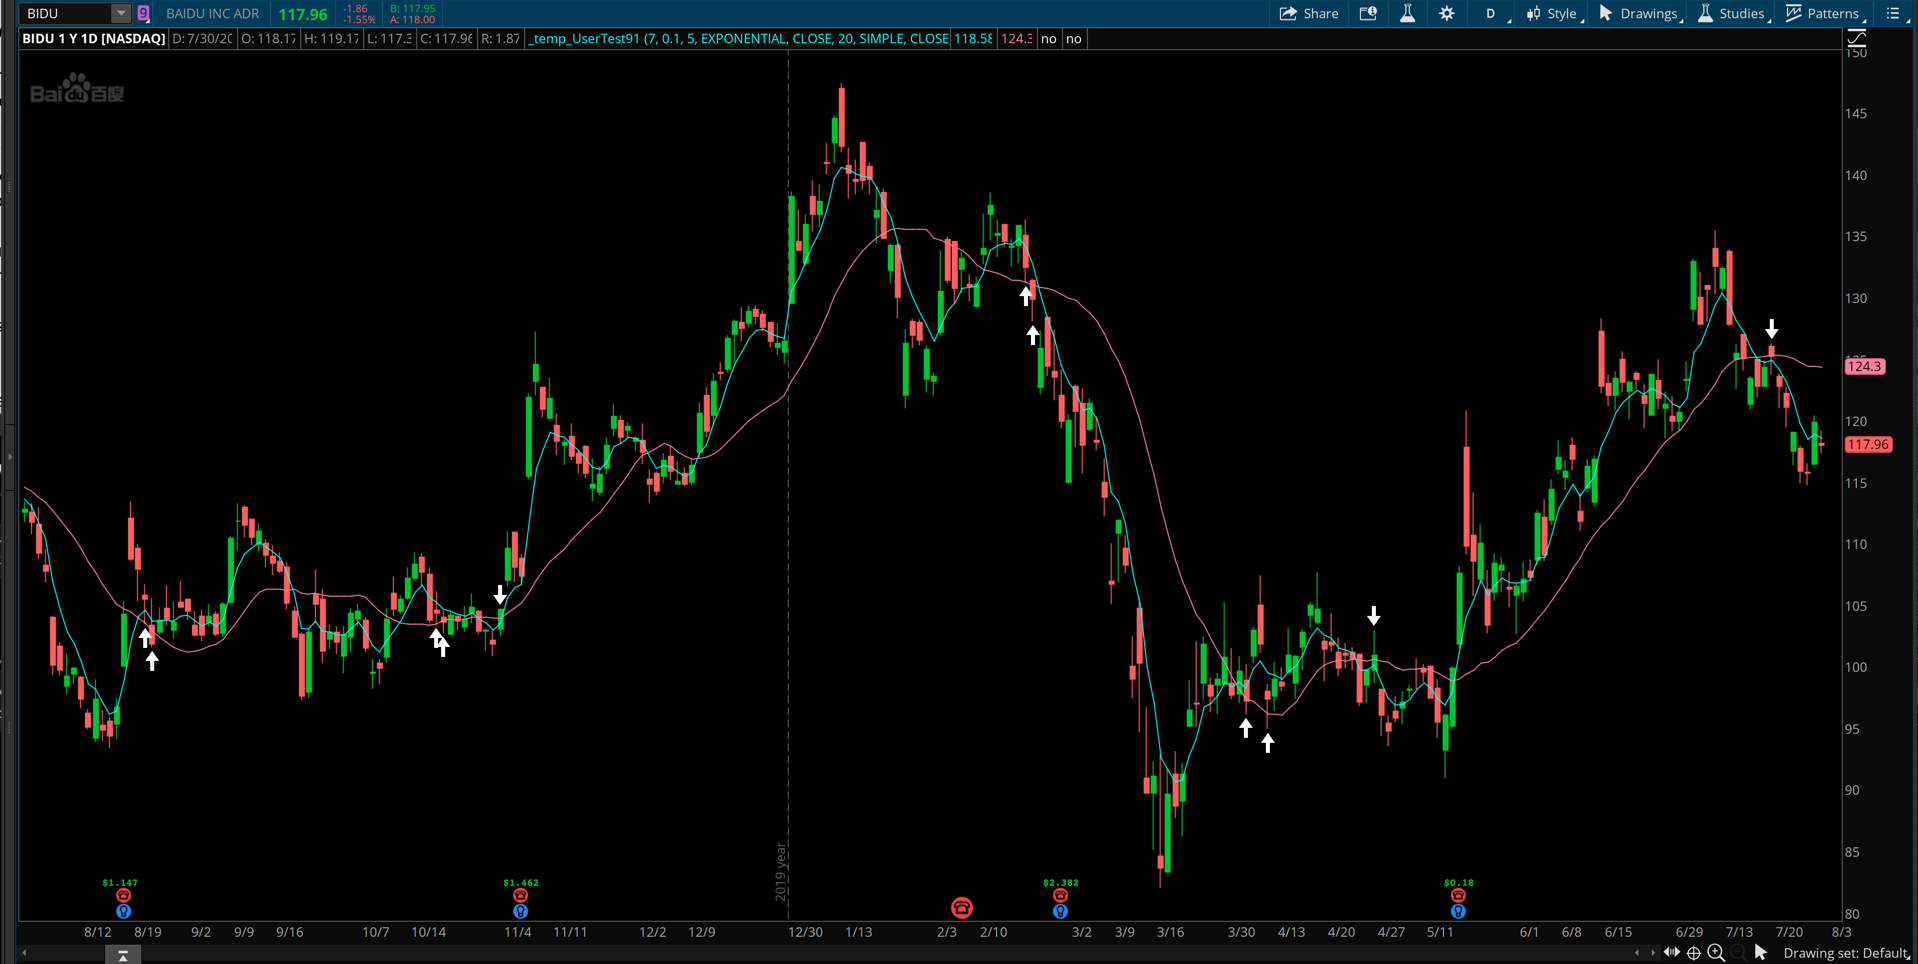
Here is the code and the screenshot below shows what it looks like on a chart after adapting it for a chart study. The code below is strictly designed for Study Alerts, Conditional Orders and scan. This is because you posted this in the "Alerts and Notifications" topic instead of the "Chart Studies" topic.
input withinBars = 7;

input percentThreshold = 0.1;

input maLengthOne = 5;

input maTypeOne = AverageType.EXPONENTIAL;

input maPriceOne = close;

input maLengthTwo = 20;

input maTypeTwo = AverageType.SIMPLE;

input maPriceTwo = close;

def maOne = MovingAverage(maTypeOne, maPriceOne, maLengthOne);

def maTwo = MovingAverage(maTypeTwo, maPriceTwo, maLengthTwo);

def crossAbove = maOne[1] < maTwo[1] and maOne > maTwo;

def crossBelow = maOne[1] > maTwo[1] and maOne < maTwo;

def hasCrossedAbove = maOne > maTwo and !crossAbove and Highest(crossAbove[1], withinBars - 1) > 0;

def hasCrossedBelow = maOne < maTwo and !crossBelow and Highest(crossBelow[1], withinBars - 1) > 0;

# use this to scan for current price within x percent of sma from above

plot scan = hasCrossedAbove and (close <= maTwo * (1 + percentThreshold * 0.01) or low <= maTwo * (1 + percentThreshold * 0.01));

# use this to scan for current price within x percent of sma from below

#plot scan = hasCrossedBelow and (close >= maTwo * (1 - percentThreshold * 0.01) or close >= maTwo * (1 - percentThreshold * 0.01));