Average price range after moving average cross


Category:
0
0

Hi guys
Any idea of how to calculate the price range 4 days ahead after the EMA8 crossing, for all instances in the last year ?

Marked as spam
Posted by (Questions: 2, Answers: 3)
Asked on May 30, 2018 1:12 pm
125 views
1
Private answer

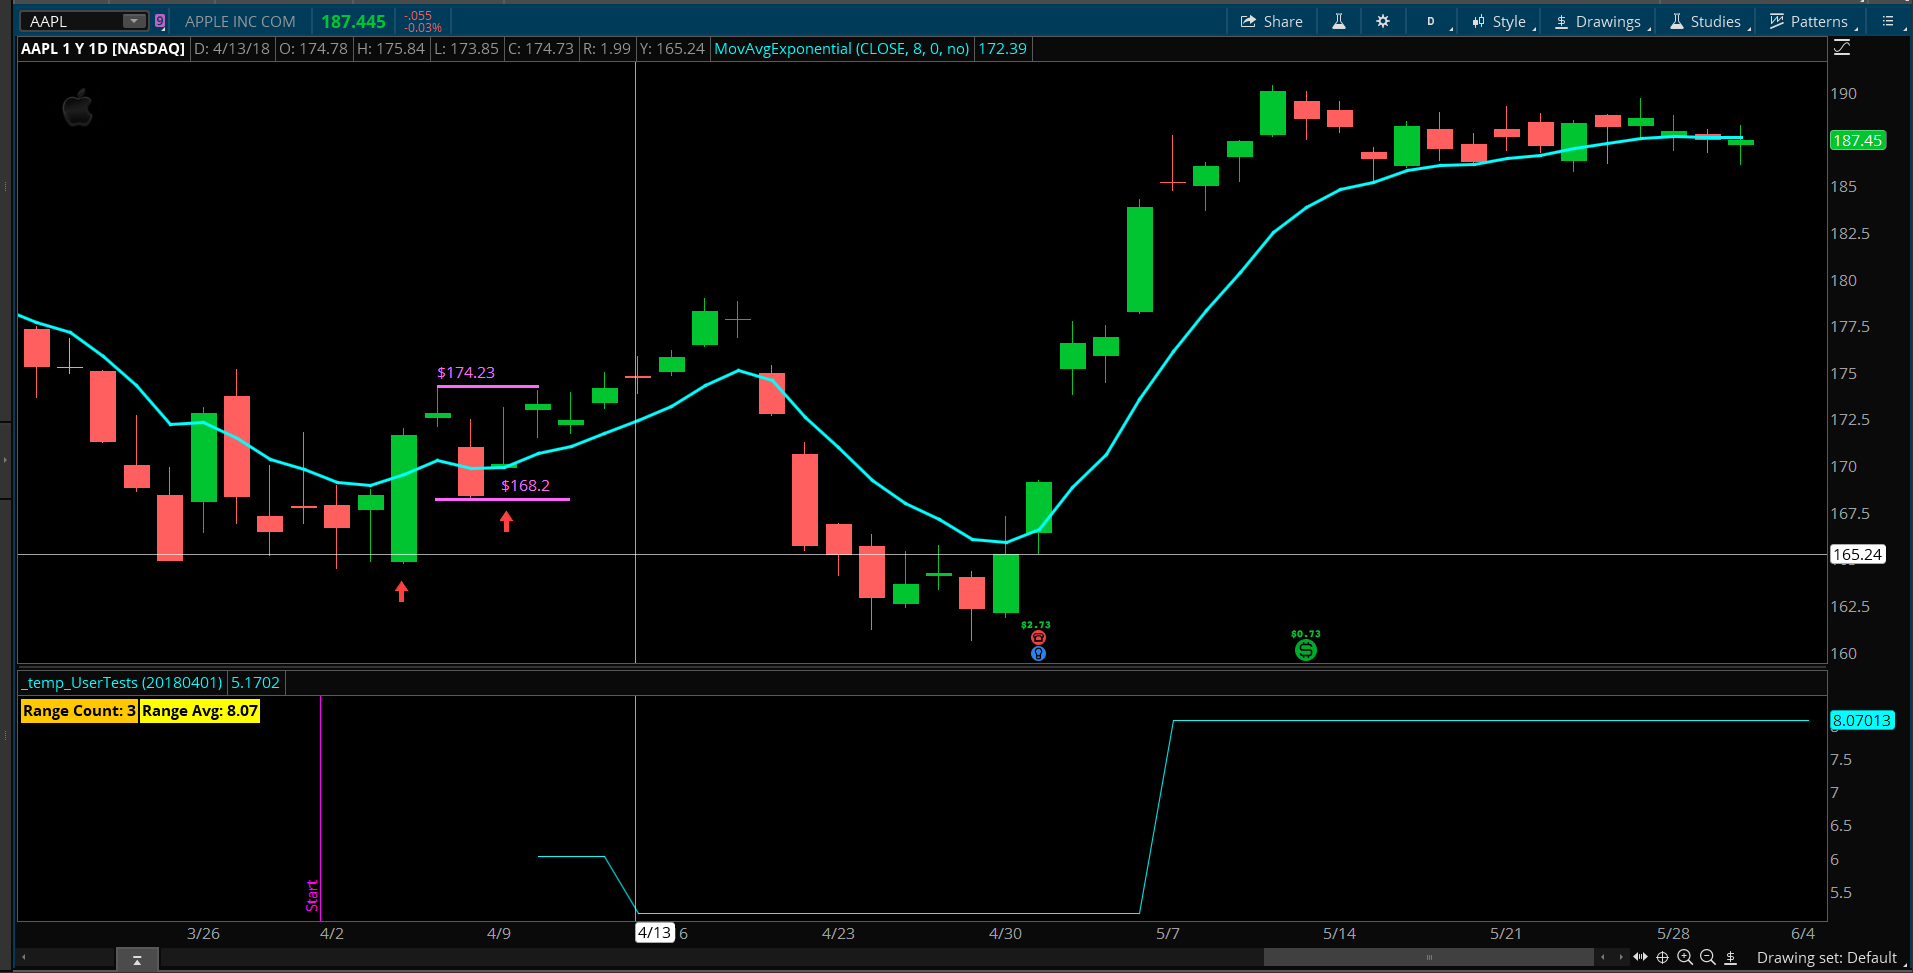
Based on feedback from Hanan Marco I have revised the code to include a user input for the start date. The previous version did not include a start date and the “prefetch” of historical data was making it impossible to test the code for proper computations.

What’s prefetch? http://tlc.thinkorswim.com/center/howToTos/tutorials/Advanced/Chapter-12—Past-Offset-and-Prefetch.html

I have included a screenshot along with the code. In the screenshot you can see the start point and I have marked the first two crossing AFTER the start point with red arrows. Four bars after the first crossing we see the lower plot begin to display a value. The value matches the range displayed via the Magenta colored vertical lines covering the four bars after the first crossing.

You can also see that for bars after the second crossing, the lower plot is adjusted to account for both the first and second crossings.

Note: In order for the start point to plot, the startDate input must be set to a day the markets were open.

declare lower;
input startDate = 20180420;
def beginTracking = DaysFromDate(startDate) > 0;
AddVerticalLine(beginTracking and !beginTracking[1], "Start", Color.MAGENTA, Curve.FIRM);
def ema = ExpAverage(close, 8);
def crossing = beginTracking and close[1] < ema[1] and close > ema;
def postCrossingRange = if beginTracking and crossing[4] then Highest(high, 4) - Lowest(low, 4) else 0;
rec crossingCount = if beginTracking and crossing[4] then crossingCount[1] + 1 else crossingCount[1];
def sumOfRanges = TotalSum(postCrossingRange);
plot averageOfRanges = sumOfRanges / crossingCount;
AddLabel(yes, Concat("Range Count: ", crossingCount), Color.ORANGE);
AddLabel(yes, Concat("Range Avg: ", Round(averageOfRanges, 2)), Color.YELLOW);

If this new answer properly addresses the initial request please be sure to give this answer an up-vote. This will cause this answer to sort to the top of the listings so it is the first answer other viewers will see.

Attachments:
Marked as spam
Posted by (Questions: 37, Answers: 4087)
Answered on May 31, 2018 10:31 am
0

Yes!
this answer properly addresses the initial request .
I learned so much from this thread
Thank you !

( at May 31, 2018 12:25 pm)
0
Private answer

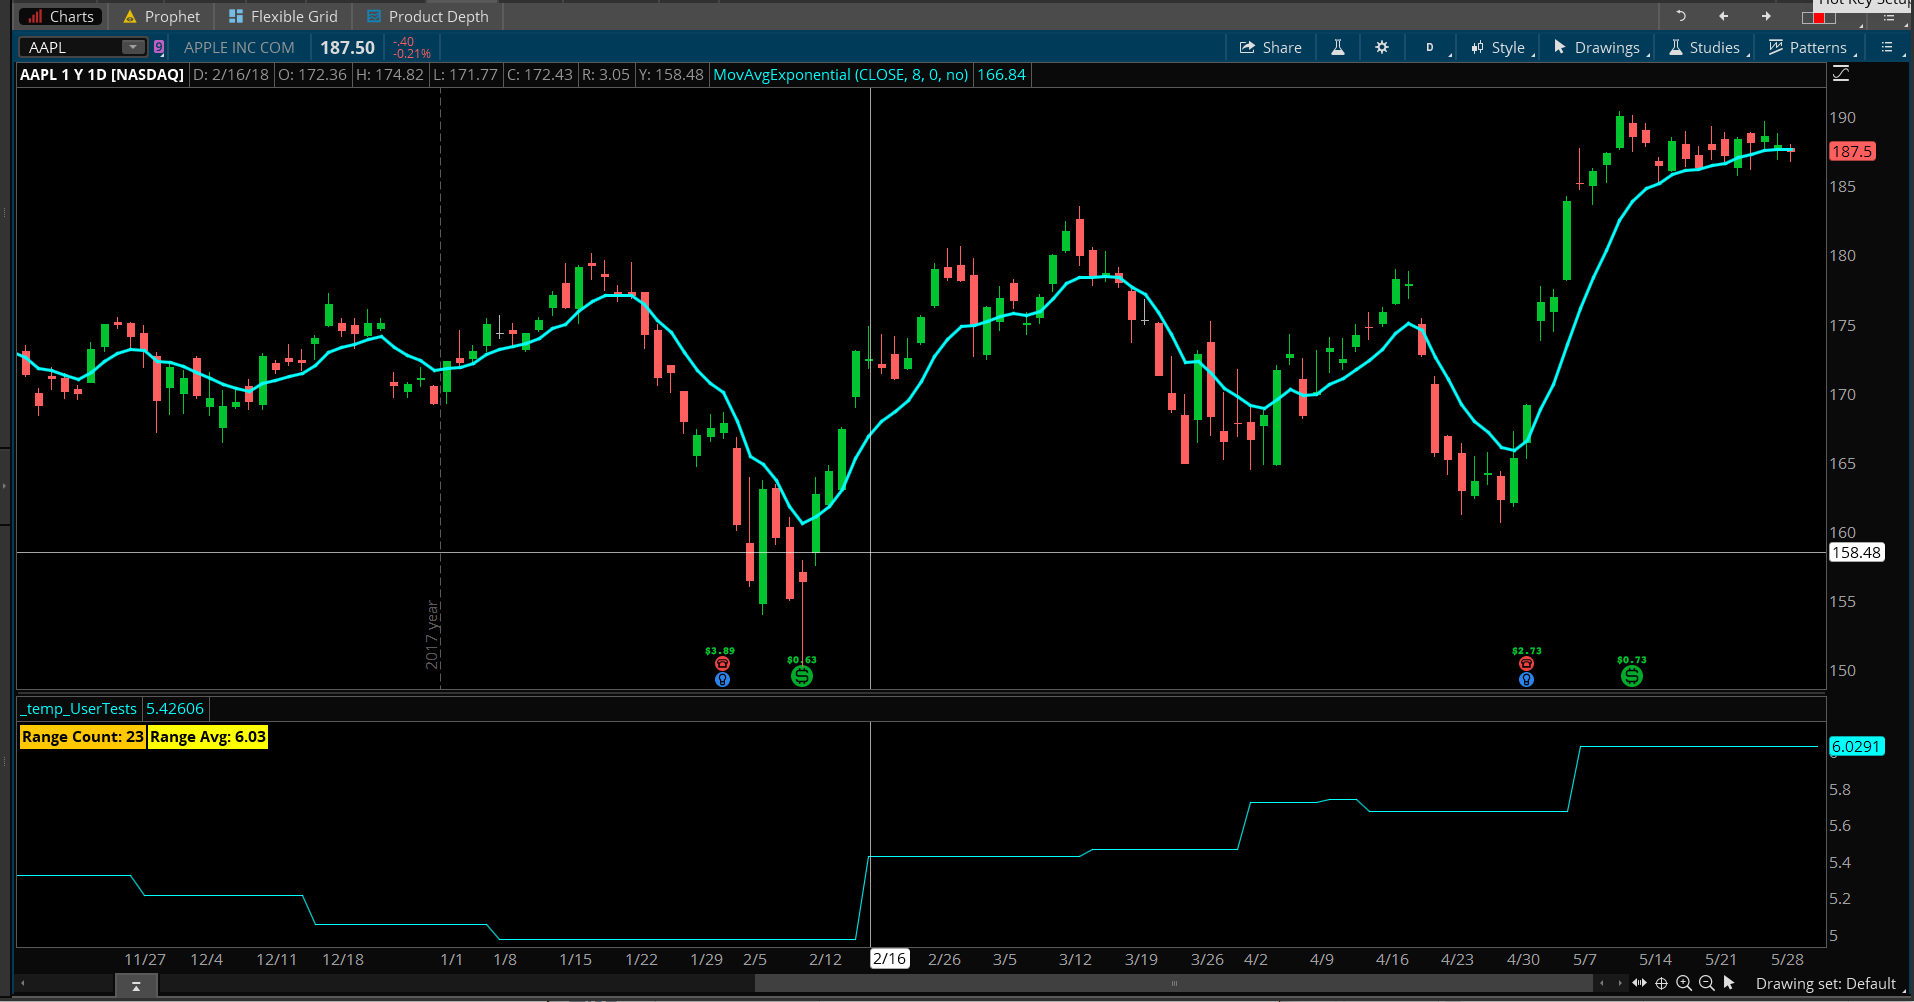
Well there is still a lot of details missing. I have to make several assumptions so you will need to provide additional details after you work with the code.

What I do here is not restricted to one year. You will control that by plotting one year of daily bars on your chart. The values are measured for all bars on the chart.

So we count each crossing and keep a running total.

Then we check each bar to see if there was a crossing 4 bars ago. When we find a crossing 4 bars ago we get the highest high in 4 bars and subtract the lowest low in 4 bars. This is the purest interpretation of the “price range” as you described it.

We then compute the total sum of all occurrences on the chart and use that to compute the average post crossing “price range”.

This code only computes the cross above. In order to do cross below you will need to replicate some lines of code and modify them to track the other side.

Here is the code. Screenshot below shows what it looks like on a chart.

declare lower;
def ema = ExpAverage(close, 8);
def crossing = close[1] < ema[1] and close > ema;
def postCrossingRange = if crossing[4] then Highest(high, 4) - Lowest(low, 4) else 0;
rec crossingCount = if crossing[4] then crossingCount[1] + 1 else crossingCount[1];
def sumOfRanges = Sum(postCrossingRange);
plot averageOfRanges = sumOfRanges / crossingCount;
AddLabel(yes, Concat("Range Count: ", crossingCount), Color.ORANGE);
AddLabel(yes, Concat("Range Avg: ", Round(averageOfRanges, 2)), Color.YELLOW);

Attachments:
Marked as spam
Posted by (Questions: 37, Answers: 4087)
Answered on May 30, 2018 2:46 pm
0
Private answer

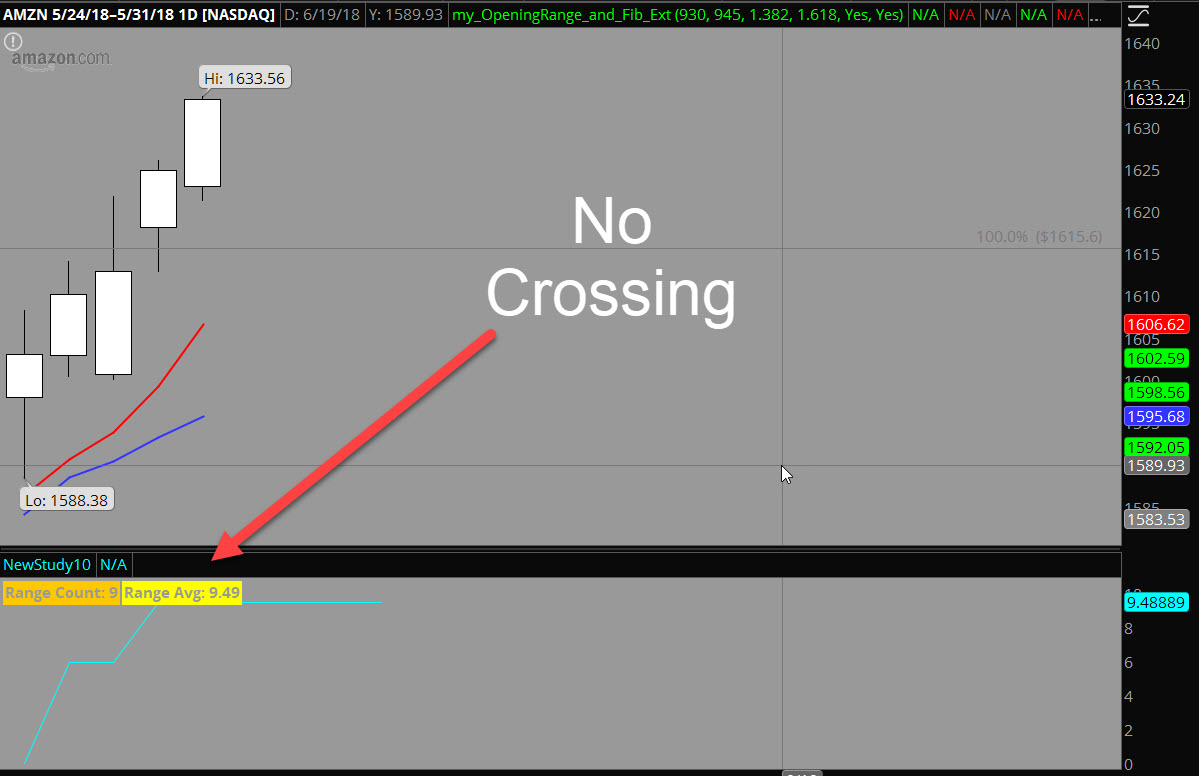
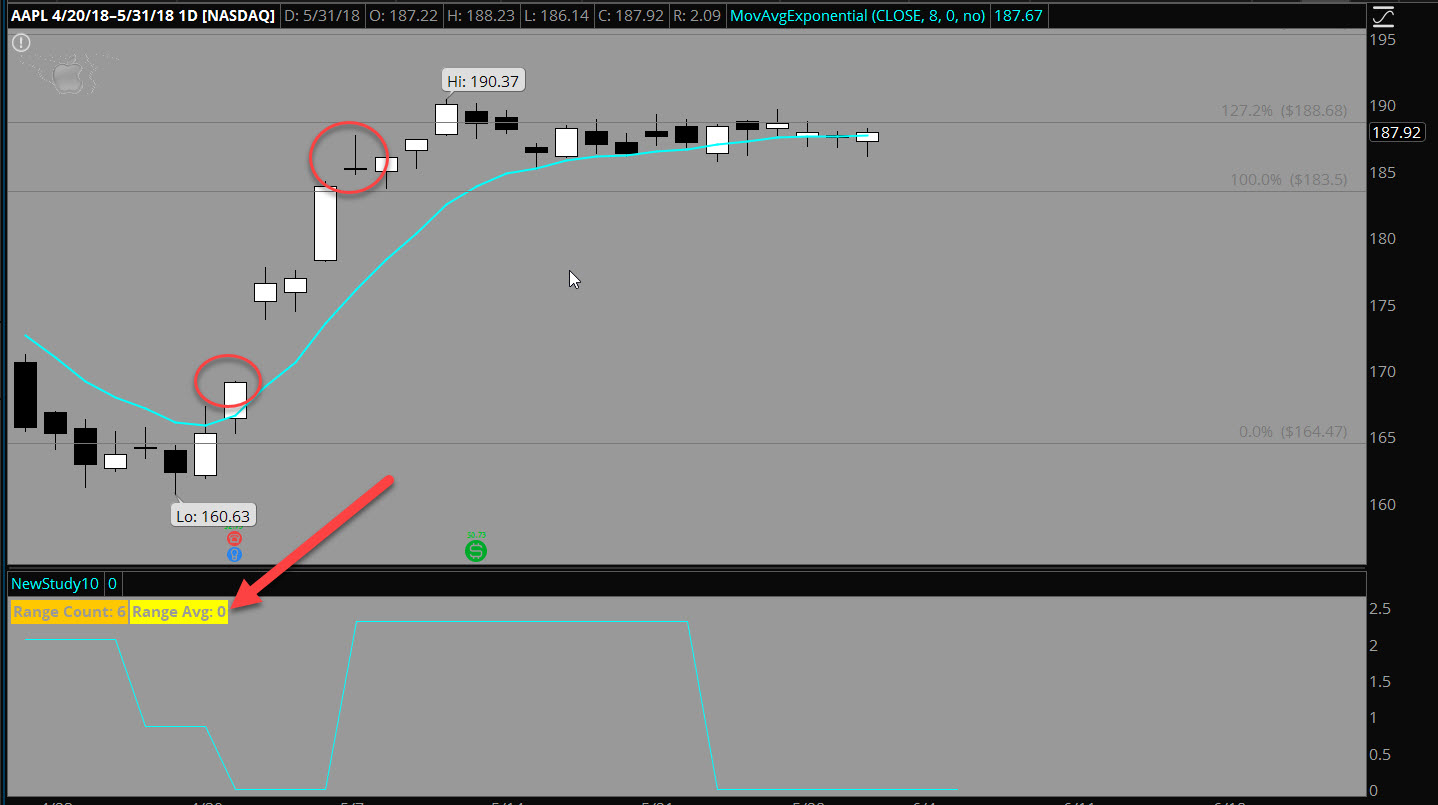
Hi

First of all, thank you very much for the help and the code, it is not obvious and I thank you.
I understood the code and even learned something new, but the result did not work out for me .
For this purpose, attached 2 examples that show wrong results within a short period of time.
I chose a short period with cross  to make the test easier.
What am I missing here?


Attachments:
Marked as spam
Posted by (Questions: 2, Answers: 3)
Answered on May 31, 2018 9:47 am
0

We usually require additional comments/questions be posted as a comment to the original question or answer and not as a new answer. But in that does not permit the inclusion of attachments. So in this case we’ll approve this “New Answer” even though it is not an answer to the post.

What you see in your examples is the result of “prefetch”: http://tlc.thinkorswim.com/center/howToTos/tutorials/Advanced/Chapter-12—Past-Offset-and-Prefetch.html

It is clear that if you need to have a strictly specified length of time we’ll need to modify the code to enable that.

( at May 31, 2018 9:59 am)
0

I did not understand what is problem in my chart and what to do to correct it. Can you enlighten me?
By the way, enlightenment about your code, I found a more convenient option to connect several strings using the + sign instead of “concate”.
And thanks again

( at May 31, 2018 10:20 am)