Bid/Ask Wall Depth Chart


Category:
0
0

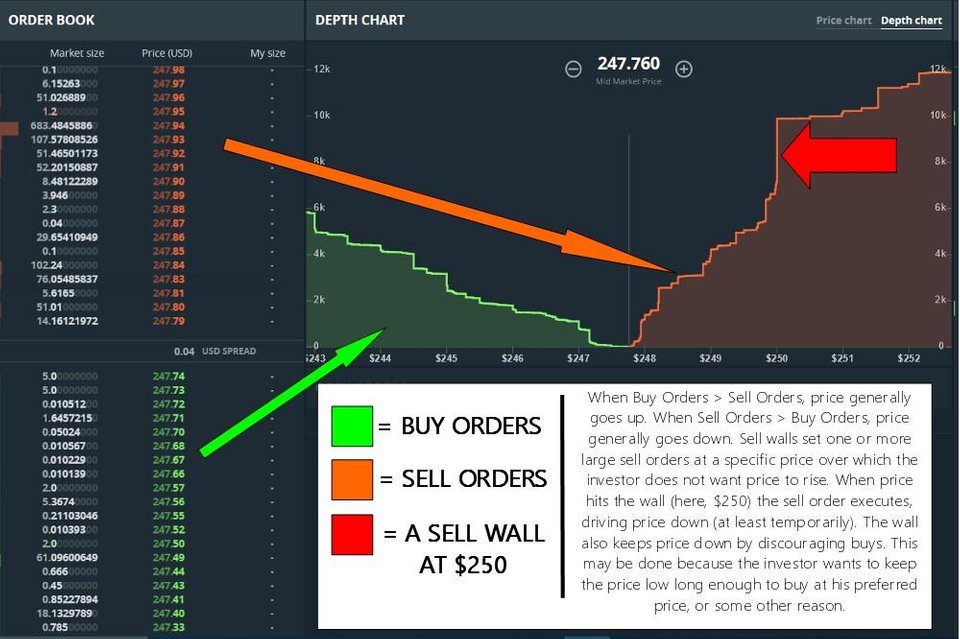
Hi guys, quick question. TOS has done an amazing job with active trader and times and sales but curious if there’s a way in TOS to visually see a market depth chart that shows the bid/ask (like a bid/ask wall). Something comparable to this image. Appreciate your thoughts.

Marked as spam
Posted by (Questions: 1, Answers: 1)
Asked on November 7, 2019 6:38 pm
76 views
0
Private answer

Negative. That's the quick answer. Now for the why. When creating custom chart studies in Thinkorswim they give us access to Open, High, Low, Close and Volume. That's it. Well we can also access number of trades. But that has already been covered in the forum. Anything more granular than this is simply not available on the Thinkorswim platform. There is no depth of market available for any code you might consider writing. You can view it in the active trader screen but that's it. Nothing more.

Marked as spam
Posted by (Questions: 37, Answers: 4091)
Answered on November 7, 2019 6:44 pm
0
Thank you Pete
( at November 7, 2019 6:47 pm)