| ♥ 0 |
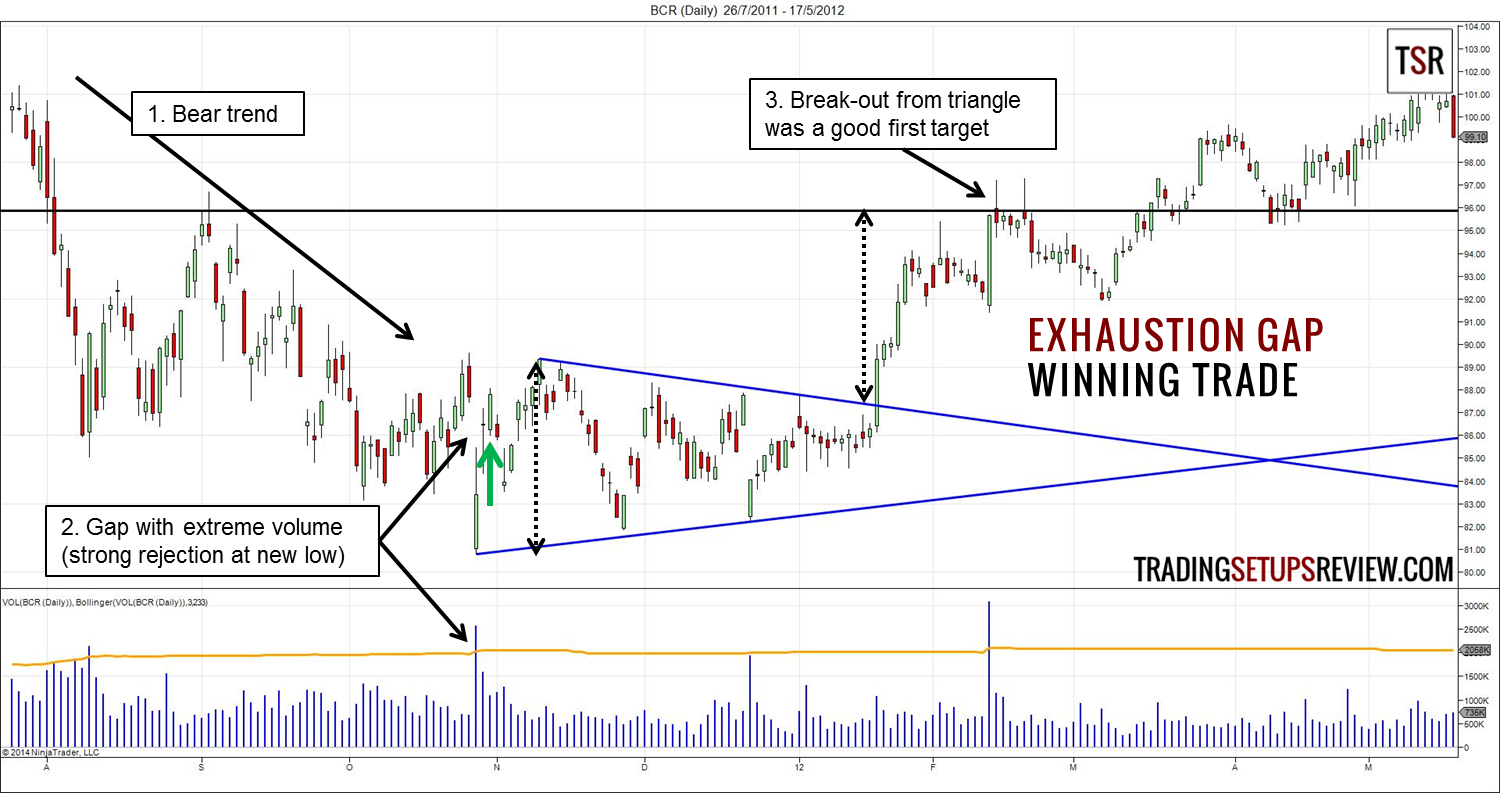
hi, was wondering if you can help me with the bollinger bands. I’m trying to add a 233-period Bollinger Band with 3 standard deviations using the volume bars. The picture below shows what i’m looking for but i also provided the link where i read about the bollinger bands but had no luck when i tried to find it in TOS . Can you help me with this?
The lower panel shows the volume. The orange line is the upper line of a Bollinger Band (233,3) for finding extreme volumes. Attachments:
Marked as spam
Asked on November 4, 2017 6:49 pm
801 views
|
|
Private answer
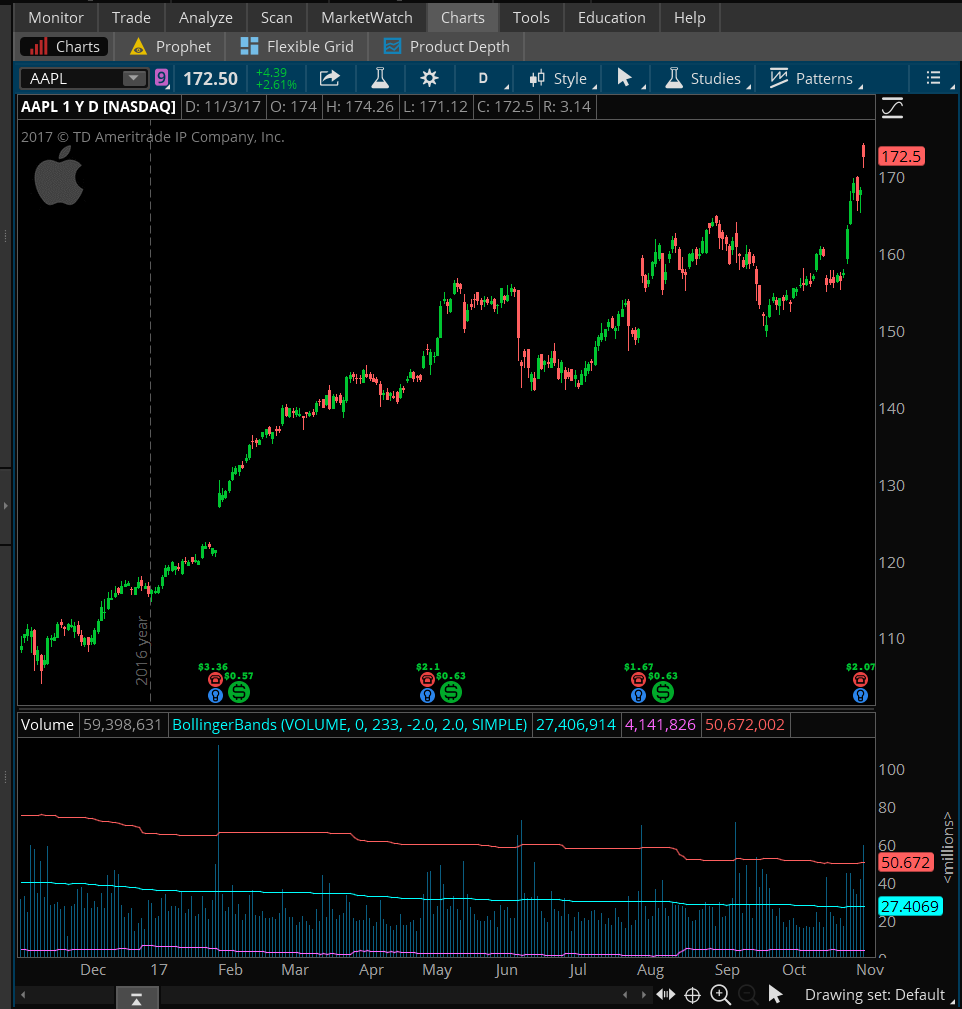
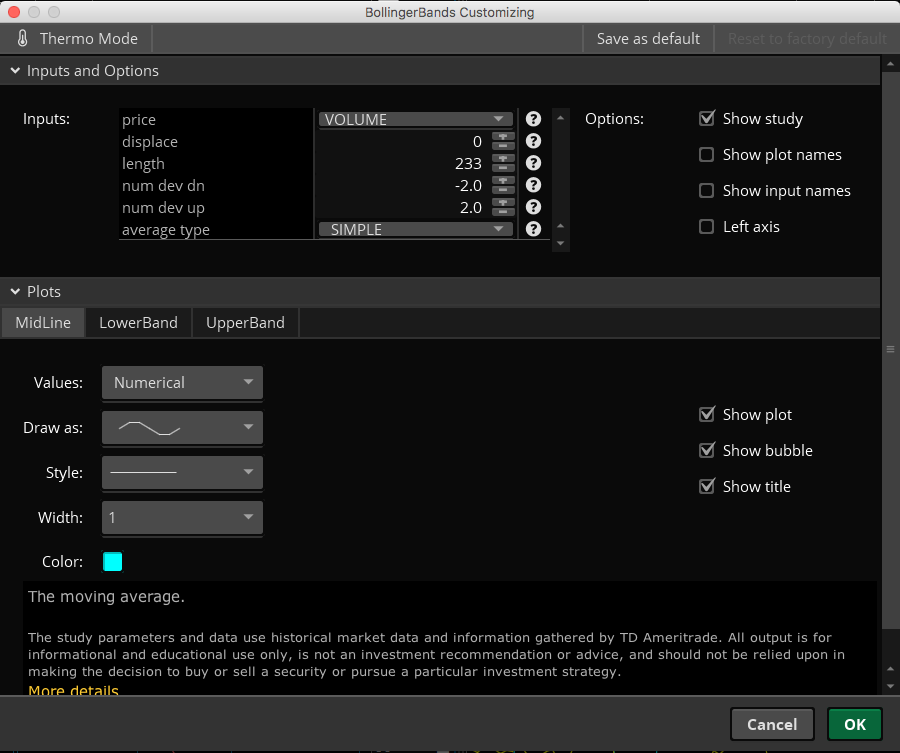
Standard, built-in functionality. Just need to think outside the box. I added a standard Bollinger Band study to a daily chart. I set the price input to VOLUME and it automatically plotted it on the volume subgraph. (you need to enable volume subgraph from Settings–>Equities–>Show volume subgraph. Screenshot below shows the result. This is currently set to 2 Std Dev as I was too lazy to change that input before doing the screen capture. Keep in mind that with a ridiculous setting of 233 periods, (who comes up with crap like this?), you must ignore the first 233 bars of the chart when viewing historical signals for back testing. However Thinkorswim does perform a prefetch when more historical data is required. But there are limits to how much data it can prefetch. Read this article for more details: https://www.hahn-tech.com/moving-averages-exponential-problems/ Attachments:
Marked as spam
Answered on November 4, 2017 8:29 pm
|
|||
|
Private answer
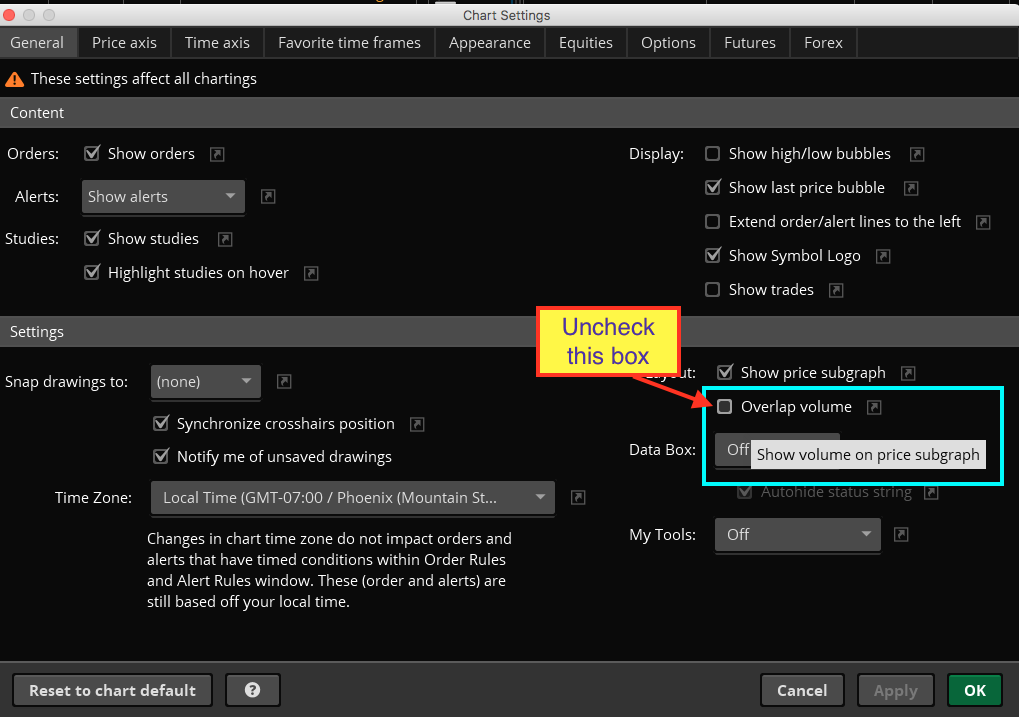
Attached screenshot shows the chart settings. I have marked the checkbox which controls the volume subgraph. Attachments:
Marked as spam
Answered on November 6, 2017 9:38 am
|
you’re awesome but i’m having trouble detaching the volume from the graph. I went to settings and when i click the arrow button to move it down, it only moves the bollinger bands and not the volume.
i’m trying to post an answer with a picture but your website doesn’t let me. It only lets me answer here. Why is that?
Because you are responding in the comment section. Which is correct. But when you want to include a screenshot you must add a new answer to the post instead of added a comment. I know it’s a bit unintuitive but this is the structure we have to work with.