Exponential Averages, not What They Appear to Be
This article “Moving Averages With Exponential Problems”, was prompted by a few different emails exchanged with our viewers. After contemplating these conversations I soon realized I needed to share this with the trading community. It is highly likely the information presented here is going to be something that has never occurred to you. If you are fond of using exponential moving averages in your setups, continue reading. If you extensively back test these setups, this article is an absolute must read. By the time we’re done, you will be armed with a healthy understanding of how to properly apply exponential averages. More importantly, you will understand what to avoid.
Let’s dive right in!
Here an excerpt from one of these emails:
The question: “Is there a way to begin calculation of various indicators at start of day”.
The answer is yes, IN SOME CASES. We must have full access to the source code. So Licensed studies are ineligible.
However once you understand the nature of the calculation you will quickly understand this request itself has serious problems.
All indicators require a specified amount of historical data before their values are fully initialized. Until that point, they are less than worthless. For example, take a 20 period simple moving average. That will require 20 candles before you can plot the first value for the day. Most indicators use exponential moving averages. A 20 period exponential moving average requires 4 times the length. So 20 times 4 equals 80 candles before the first usable value is available on the chart. Still other indicators apply an exponential moving average to an exponential moving average. Throw those in the trash.
So even if you are using a 1 minute time frame, you will be well into the second or third hour of the trading day before you have any values that are usable.
….and another:
I have another strategy that needs coding! I would like this to be plotted on the chart and have a scan made as well. This strategy is only for going long. The timeframe is the monthly.
I’ll need to provide a few more details about that last email. Notice it specified a scan, using the monthly time frame. From Thinkorswim’s own documentation: http://tlc.thinkorswim.com/center/howToTos/thinkManual/Scan/Stock-Hacker/studyfilters.html
At the very bottom of that linked page we find that for monthly aggregation periods, there is a historical data limit of 730 calendar days. (this includes weekends and Holidays) The number of trading days is more like 504. But that’s daily candles. When we switch that to monthly we are now only working with 24 candles. Now pay very close attention here because this is where we introduce the exponential problem.
The Math
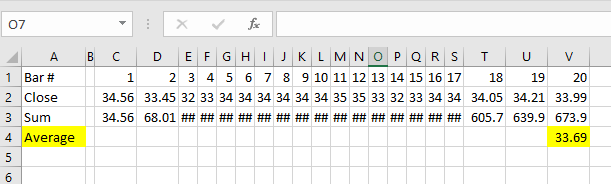
In the case of that last email the client was using two indicators, each based on exponential moving averages. How many historical candles does it take to fully calculate an exponential moving average? Before we complicate things, let’s start with a simple moving average. If we want to calculate a 20 period simple moving average, we simply take the sum of each close for the last 20 bars and divide by 20.
From the example spreadsheet formula, you can see that we don’t get the first usable value for the 20 period moving average until we reach bar number 20. We can’t do anything at all with bars number 1-20.
Ok, as that little bit is settling into the grey matter let’s examine the exponential moving average. I won’t bore you with the exact formula. Instead I will direct your attention to another piece of documentation from Thinkorswim: http://tlc.thinkorswim.com/center/howToTos/tutorials/Advanced/Chapter-12—Past-Offset-and-Prefetch.html
Prefetch
The main point to understand from that document is something called Prefetch. Under that section of the document we find that exponential averages require length times 4 in order to become “range-independent”. Which is similar to saying “fully initialized”. Did you also notice the requirement for Wilder’s average? That is length times 7! Ouch! So in the example we gave for the simple moving average, 20 periods. Change that to a 20 period exponential moving average and now we don’t get to a usable value until bar number 80! Don’t worry, I have a spreadsheet to clear this up in case you are still trying to get your brain around this. Click on the image for a larger view.
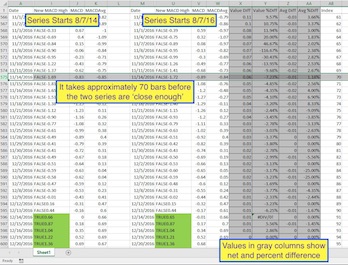
The spreadsheet
First, let me explain what we have there in that spreadsheet. I used TradeStation to download historical chart data. There are two series of historical data shown. Columns I, J, & K are the first series, which contains historical data back to 8/7/14. Columns U, V, & W are the second series, which contains historical data back to 8/7/16.
So series one has 3 years historical data, series 2 has 2 years historical data. The data show the computed value of the standard MACD study, set to exponential moving average. The values in columns X through AA show a comparison of the two series. Focus on the Value %Diff, column Y.
In the final column on the far right you will find a value called ‘Index’. This is just a bar counter. It is counting the number of bars in series 2. So whatever the Index value is, we know that series 1 has another full year of historical data. These are daily bars, so that means when you see an index value of 70, it means the bar number for series 1 is 70 + 252 = 322. While the bar number for series two is the index, 70.
Ok, now that we have explained the details of the spreadsheet…
The math does indeed show it takes length times 4 before an exponential moving average is fully initialized. However the spreadsheet shows that we narrow in on an exact match rapidly as we approach an index value of 70. For the MACD we would be using 26 times 4 = 104. But we can see that we have some usable values quite a bit before we get to 104. It all depends on how much tolerance your setup can accommodate.
You can now focus on the column named ‘Value Diff’. You can see at the top of the column we are off by 11. At the bottom we are off by 0 – 0.1. At the 70 index we are off 0.6. That seems acceptable to me, but you may have a threshold that is more or less than this. You can see the %Diff varies wildly until we get past index 70. So any values prior to this are basically garbage. Throw them away.
But what about Prefetch? Thinkorswim handles this problem for us, they say so in that document you linked above. Oh, did you not read the document? Well, good thing I asked the question for you then. Because we are still not in the clear. Here is the description from Thinkorswim:
Prefetch
Prefetch is a property characteristic of Exponential Moving Averages that consists in fetching historical data prior to beginning of time period. This property enables these functions to be range independent. Three thinkScript® functions use prefetch: ExpAverage, EMA2, and WildersAverage.
Let’s get a crystal clear picture of prefetch in action. Click on the image for larger view.
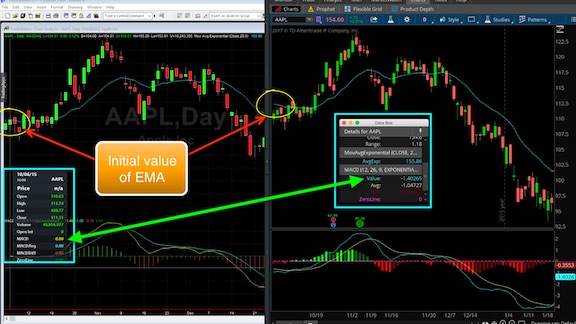
In this image we have TradeStation on the left, Thinkorswim on the right. Each chart contains identical data (2 years of daily bars, ticker symbol AAPL). I have scrolled each chart to the far left, so we can examine and compare the values of the first viewable bar. Notice the exponential moving average has a different starting value. Likewise the MACD plots are not the same. On TradeStation the MACD plots are initialized at zero. While the same indicator on Thinkorswim shows very different values. This is the impact of prefetch. The TradeStation chart is not applying any prefetch, while the Thinkorswim chart is.
How much of this has sunk in?
Let’s give you a little quiz to see if you have assimilated the main points of this article. Notice the date of the first bar, 10/5/15. How many more historical bars do we need to the TradeStation chart, before the MACD values of both charts match on the date of 10/5/15? (hint: go back and examine that spreadsheet comparing the two sets of MACD values).
If you came up with anywhere between 70 and 104 bars, pat yourself on the back. You got it! If you still don’t get it, put the article down and read it again it in a couple of days. Post on our Q&A Forum if you are still struggling to grasp this concept.
So, prefetch solves all our problems…. or does it?
IPO’s and other newly issued stocks
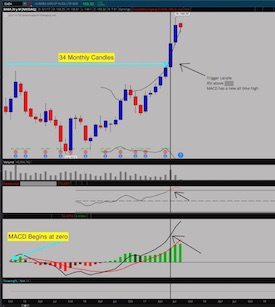
Here is a chart submitted by a client. Notice how all the MACD plots begin right near the zero line. But what happened to prefetch? This is Thinkorswim chart. Prefetch only works when there is historical data available to fetch. For this ticker symbol, the trading only started 3 years ago. So we only have 34 monthly candles to work with. From what we have learned up to this point, we know that any indicators based on exponential moving averages are useless until they have become “range-independent”. Which is the length of the exponential average times 4. On a monthly chart, that is nearly NINE years of historical data you can’t use. Anything before that is just poking around like a blind squirrel trying to find its way.
If you were to switch the MACD to use a simple moving average, we only need to wait 26 candles before the values are “range-independent” and fully useable. That would be just over 2 years of monthly candles.
Quite a lot to absorb
It took me a very long time to understand these concepts. I believe the vast majority of traders haven’t the slightest idea this is a factor. In other platforms, the indicators have no way to reach back for more historical data to ensure the exponential averages are fully initialized. As bad as this is, it is merely the tip of the iceberg. The other day someone asked me about an indicator that is built into Thinkorswim. It is called “SVEZLRBPercB”, and it uses double and triple exponential moving averages. Worse yet, those are applied to another built-in study called RainbowAverage. Which is another series of nested moving averages…. Who in their right mind comes up with this stuff?
So what is the true impact of this knowledge. Having come to this point, what do we do know?
Scans, Watchlists, Study Alerts, Conditional Orders
In Thinkorswim, we have a scan engine that has a fixed limit of historical data. There is no prefetch for the scan engine in Thinkorswim. So whenever you are trying to work out a discrepancy between scan results and the chart, consider an exponential moving average may be the culprit. On TradeStation, the scan engine actually has the ability to prefetch historical data. You need to make sure you filter out ticker symbols that lack sufficient trading history to cover your prefetch needs.
Strategies
On a platform like TradeStation, pretty simple. Don’t permit any theoretical orders to be placed until your moving averages have become “range-independent”. For Thinkorswim the solution is more challenging. You have prefetch working for you. But how do you know if any given ticker symbol has sufficient historical trade data from which to fetch? You might use something like:
!IsNaN(close)[252]
Which will try to get the close from 252 bars ago and test to see if it there is an actual value there. Change the value of 252 to whatever is appropriate to initialize your components.
Conclusion
We now understand that using exponential moving averages requires us to compute how much historical data is required to become “range-independent”. Depending on the platform, we must take deliberate steps to avoid using any data prior to reaching “range-independence”. Many chart studies apply layers of exponential moving averages, making is very difficult to be absolutely certain we know where “range-independence” has been established. Requiring us to export historical data into a spreadsheet and perform a thorough analysis. Don’t forget about the newly issued stocks. Until sufficient trade data accumulates, certain indicators should be avoided.
Closing remarks
Keep your eyes open. Long term moving averages should be switched to simple moving averages. How many times have you seen someone present a chart with a 100 period EMA, or a 200 EMA? Do you think they understand how much historical data they need to load into the chart to ensure it is fully “range-independent”? You do. Congratulations.
I don’t quite understand how the prefetch works. What is the mathematical treatment of the prefetch data before it becomes Exp1?
There really is no better way to explain it then what I have presented in the article. Prefetch is a term defined by Thinkorswim developers. There is a link in the article to their explanation of how it works, what it does and why it’s there.
Don’t see the problem, if you have sufficient historical data prior to live buys or sells.
Am I wrong?
That is the problem exactly, and that is the main point to remember from this discussion. The other point to remember is that not all platforms handle this the same. Some do not perform any prefetch of historical data. Another key point to realize is that nested exponential moving averages obfuscate the amount of historical data requirement and may fool even the platforms that do have prefetch.
So have you ever been able to get your EMA’s between TOS and TradeStation to match? On a 240 minute chart they are quite different and it’s driving me nuts.
From this article we know that it will take 104 bars on the chart before TradeStation EMA’s will catch up with Thinkorswim. So it should merely be a matter of putting enough historical data on the chart.
I have noticed that several of my custom indicators that use exp avg have discrepancies. Data printed on my chart will change several bars back if a major price move occurs. Is this common with the exp avg issue you are addressing?
No way to know for certain without seeing your code. But I can tell you the behavior you described is a major red flag.