Bounce off of Span B Ichimoku with TICK CHART scan


Category:
0
0

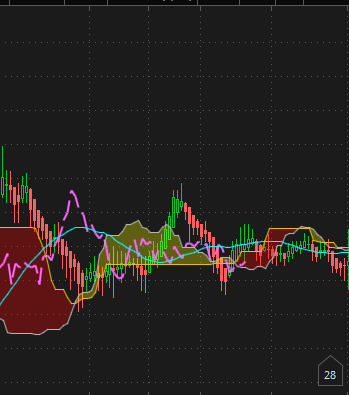
Hi Mr. Hanh,  is there any way to create a  ichimoku scan with a tick chart. I would like to scan for stocks that bounce off  Span B (yellow) by two candles.

Tick Chart time frame 2 day ,100 ticks.


thank you again

Attachments:
Marked as spam
Posted by (Questions: 5, Answers: 7)
Asked on March 12, 2017 8:55 pm
233 views
0
Private answer

Sorry but at this time the Thinkorswim scan engine only supports standard time based aggregation periods. Be sure to submit a feature request to support at TD Ameritrade and request this be added to a future release of the Thinkorswim platform.

Marked as spam
Posted by (Questions: 37, Answers: 4087)
Answered on March 12, 2017 10:05 pm