| ♥ 0 |
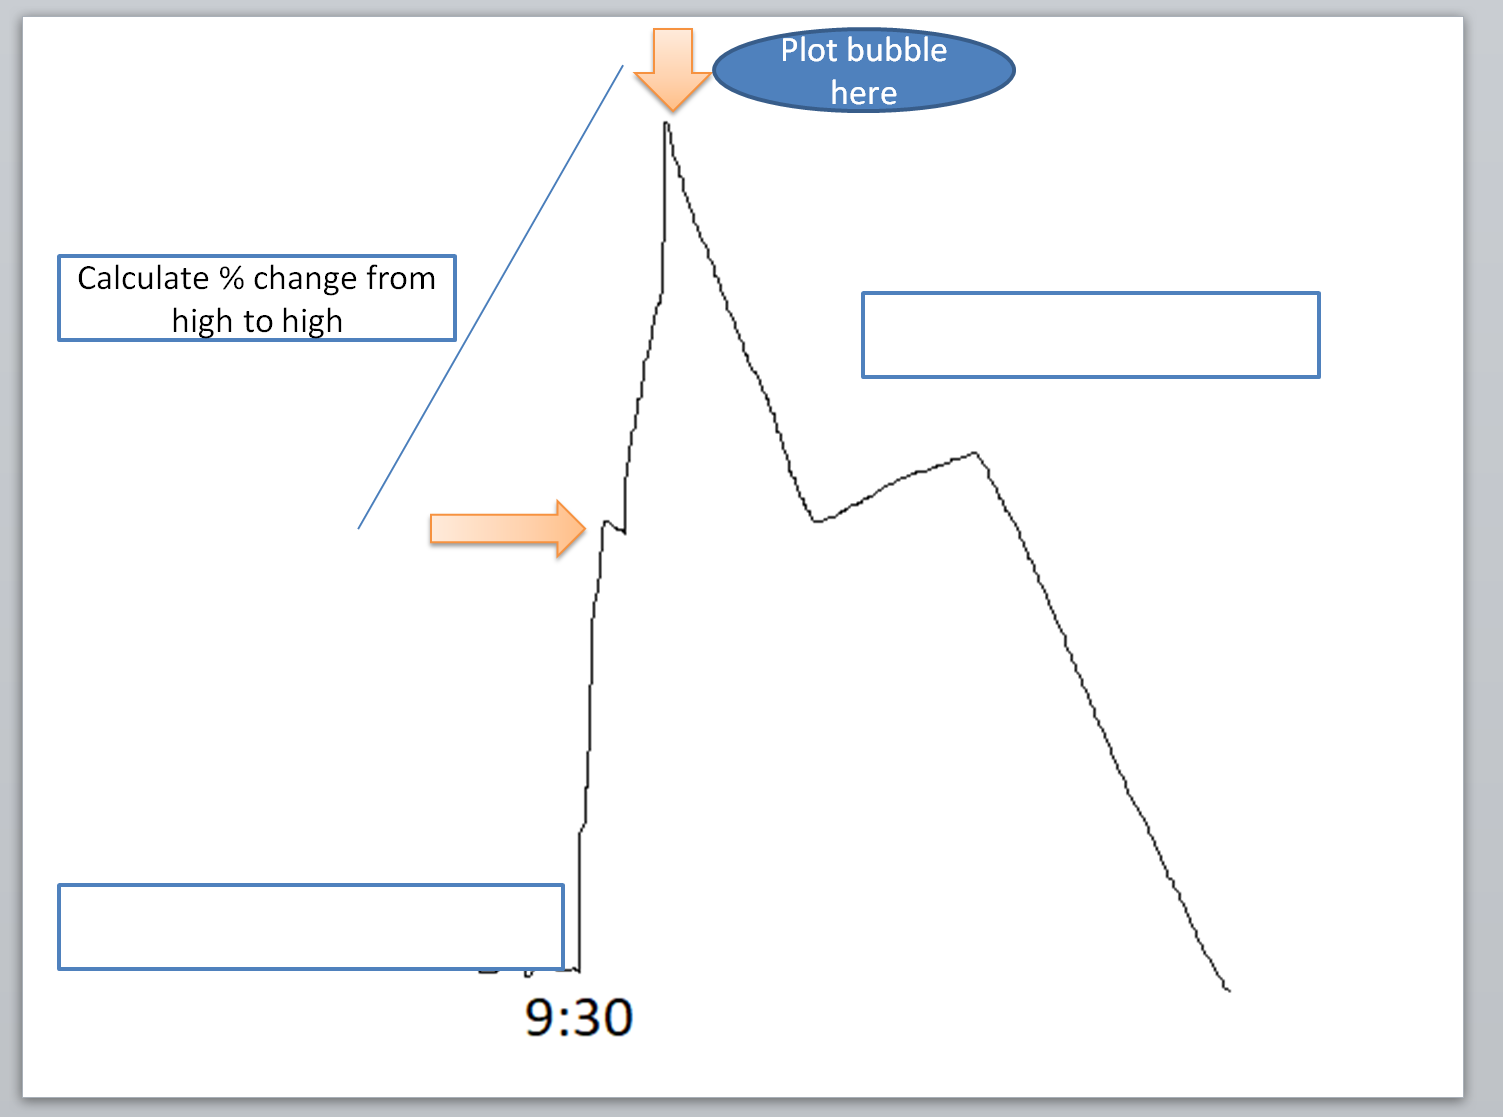
Hi Pete, I wanted to know how to create a study that detects and plots when a stock creates a new high over a previous high pivot and the move is greater than 1 dollar. For example, a charts previous high pivot was $2.50 dollar , Then makes a large move to $3.50+.
Next, the study should plot a bubble that shows the %change from the previous high pivot to the current high.
Optional The study should also plot a dashed line at the previous high ( in this case of $2.5).
I have included a screenshot of a case example Thank you for you help Attachments:
Marked as spam
Asked on July 26, 2019 5:48 am
104 views
|
|
Private answer
Patterns such as this may appear simple. However the code required to achieve this is quite advanced. I have clients that have paid for solutions much less complicated than this so in order to be fair to them I cannot provide a free solution to this. You can submit this as a custom project request if you would like. When doing so, you will need to fully define how you determine this "previous high pivot". I can make some suggestions but it's really up to you. There are many different ways that traders define a pivot high/low on the chart. I do not make assumptions or provide my own interpretations. Custom project requests can be submitted here: https://www.hahn-tech.com/about/ Be sure to read the entire page before filling out the contact form. Marked as spam
Answered on July 26, 2019 9:40 am
|