| ♥ 0 |
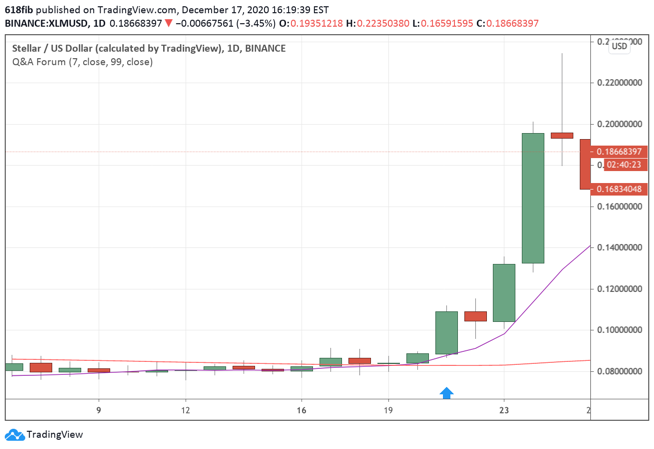
Hi Pete, can you help me make a script/code for TradingView. To make a chart signal when MA7 (purple line) touching the low of a green bar PLUS MA7 is greater than MA99. I cannot find that much information here in regards to TradingView scripts/codes. It’s mostly TOS. Thanks in advance. I apologize for the previous sample screenshot. I have attached a better sample for you here since I cannot make an attachment in the comments. So I created a new question. Attachments:
Marked as spam
|
|
Private answer
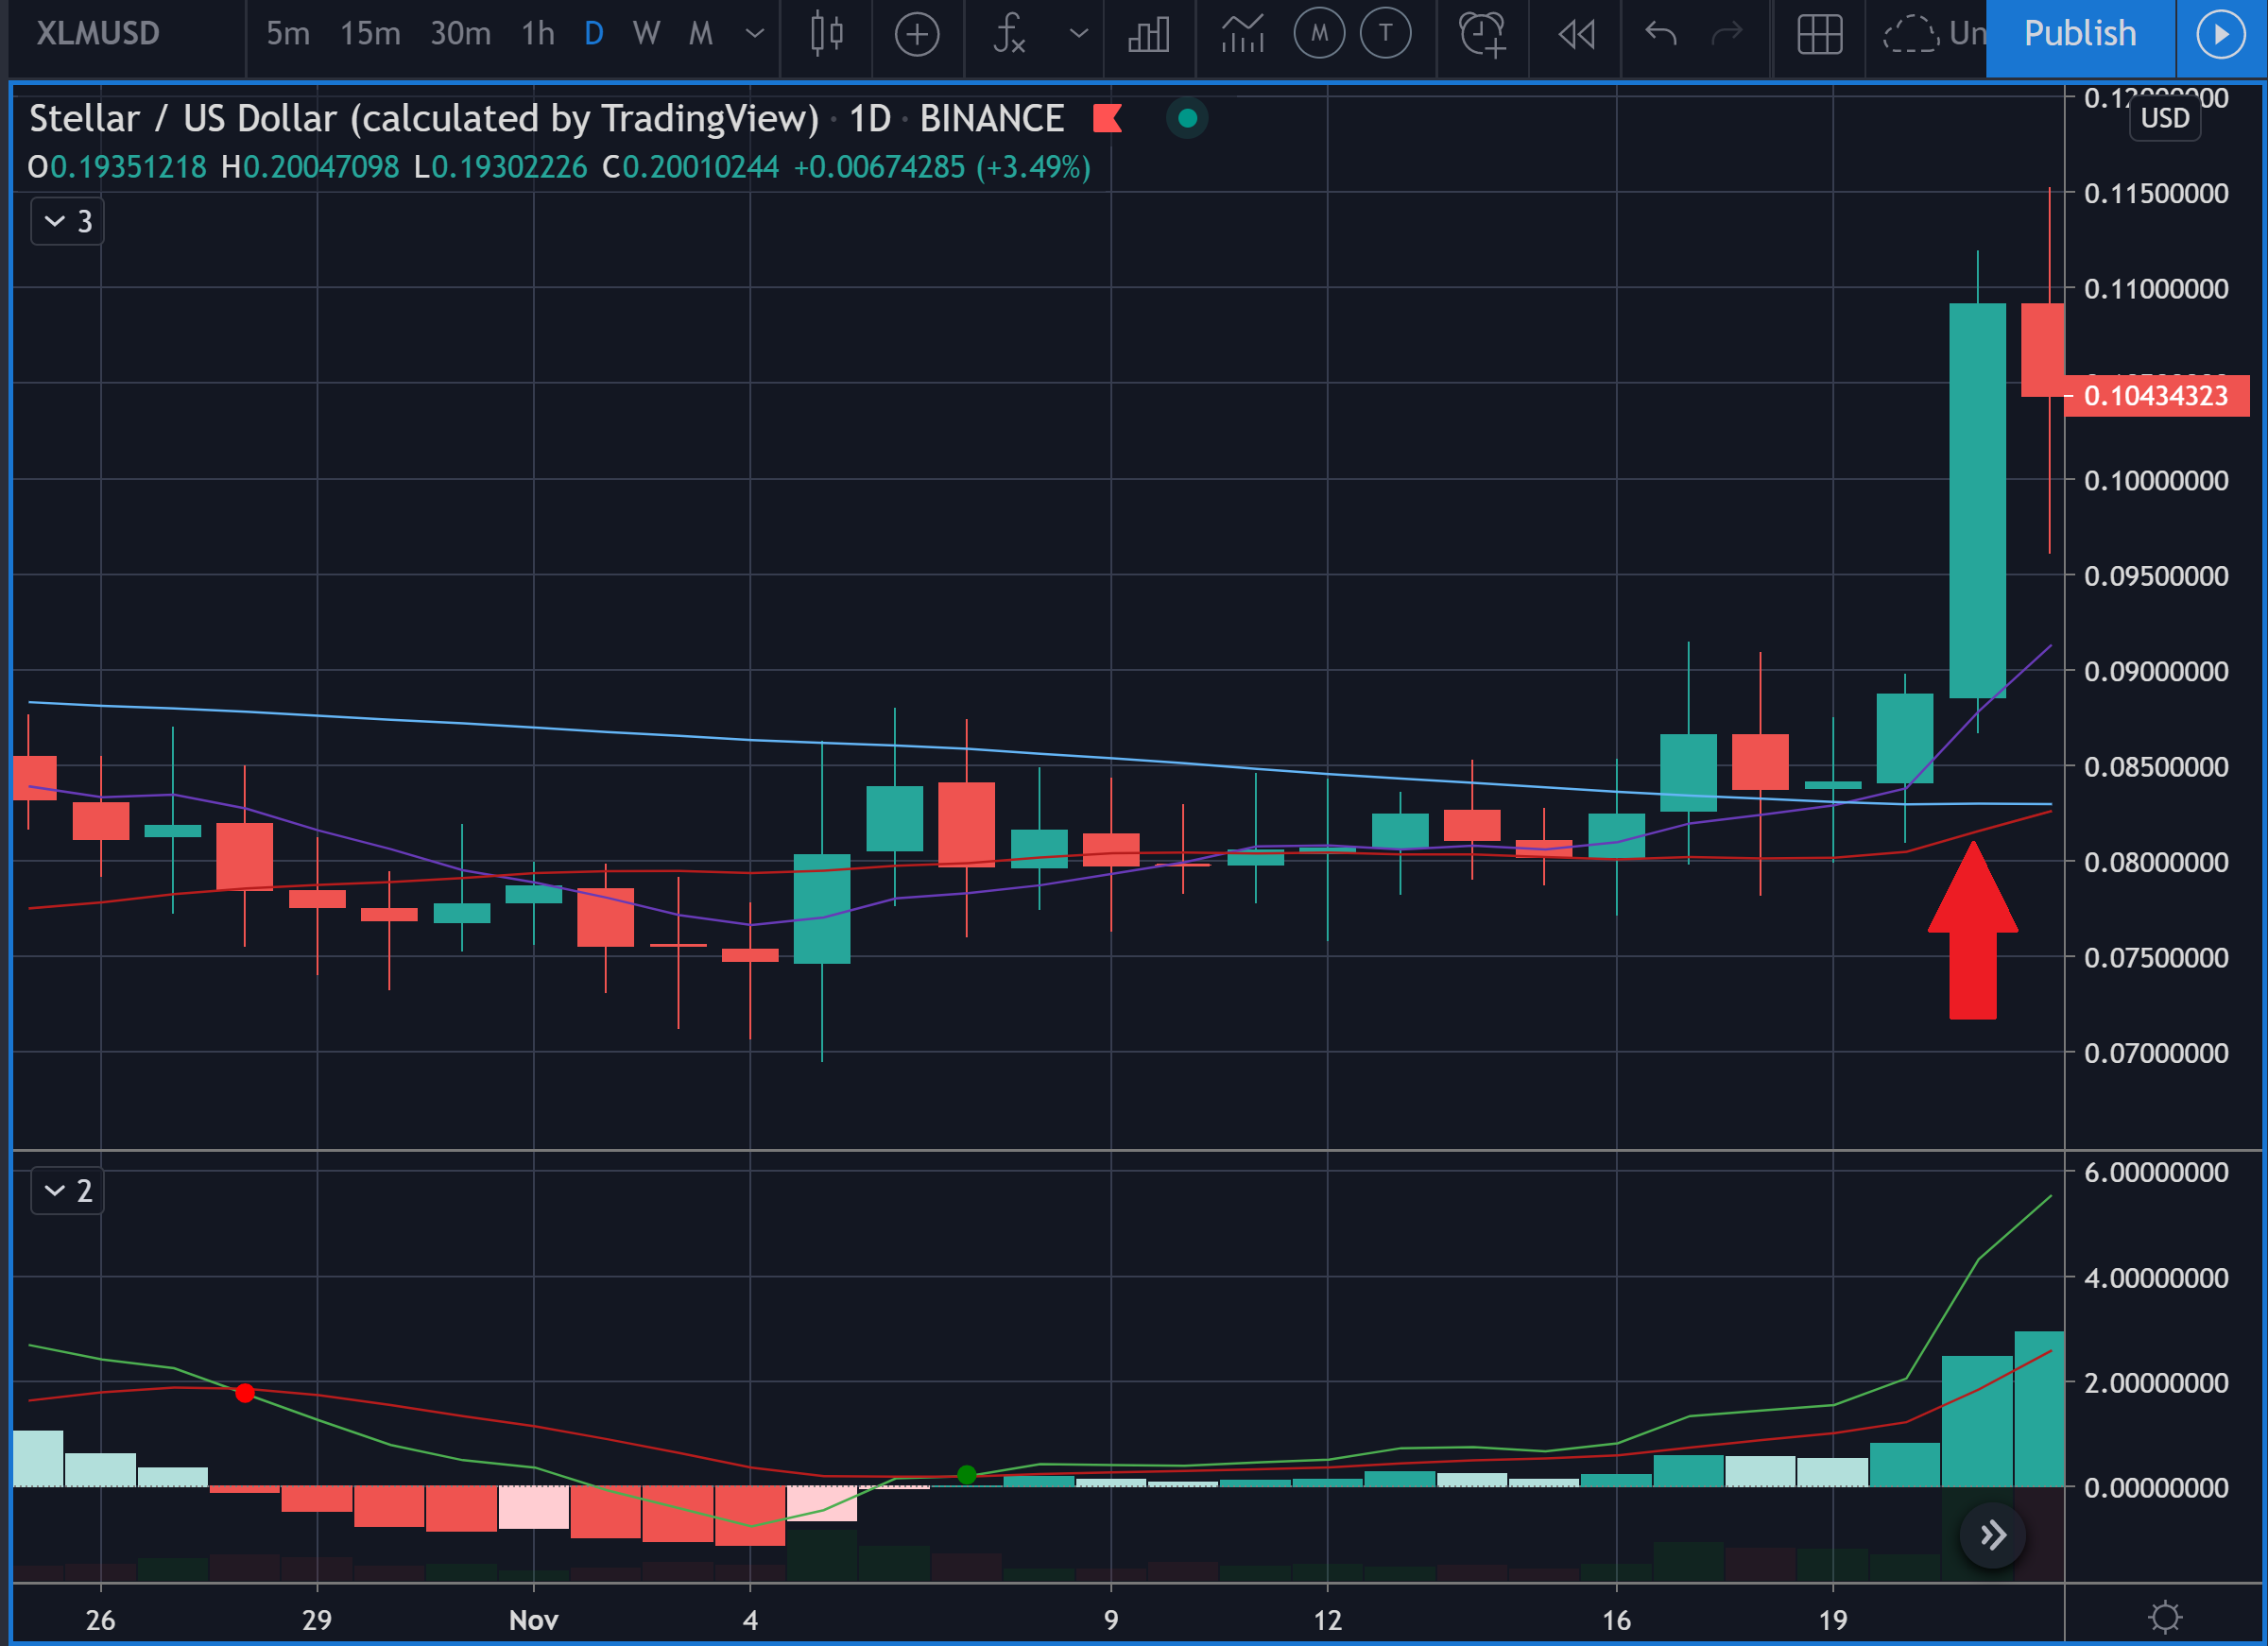
Before I can attempt a solution here you need to provide a much clearly description of the following element from your request:
In the screenshot you provided the moving average is between the low of the candle and the open of the candle. The moving average is not "touching the low". So please be very clear about what you intended to say in that portion of your request. One might be able to describe this as the moving average "crossing through the lower wick of the candle". But that is a far cry from "touching the low of a green bar". Sorry to be so picky. But computers see things in black and white and the person writing the code must boil things down to a set of true or false conditions with exacting precision. Marked as spam
Answered on December 17, 2020 9:55 am
|
|||
|
Private answer
Please review the comments section of my previous answer to get the full specification for this solution. Here is the pinescript you can add to a new chart study on TradingView.com. If we get a significant number of requests for TradingView solutions I will add a new topic the the Q&A Forum to serve users of that platform.
Screenshot below shows the result. Attachments:
Marked as spam
Answered on December 17, 2020 2:27 pm
|