Chart study indicators pivot High/Low


Category:
0
0

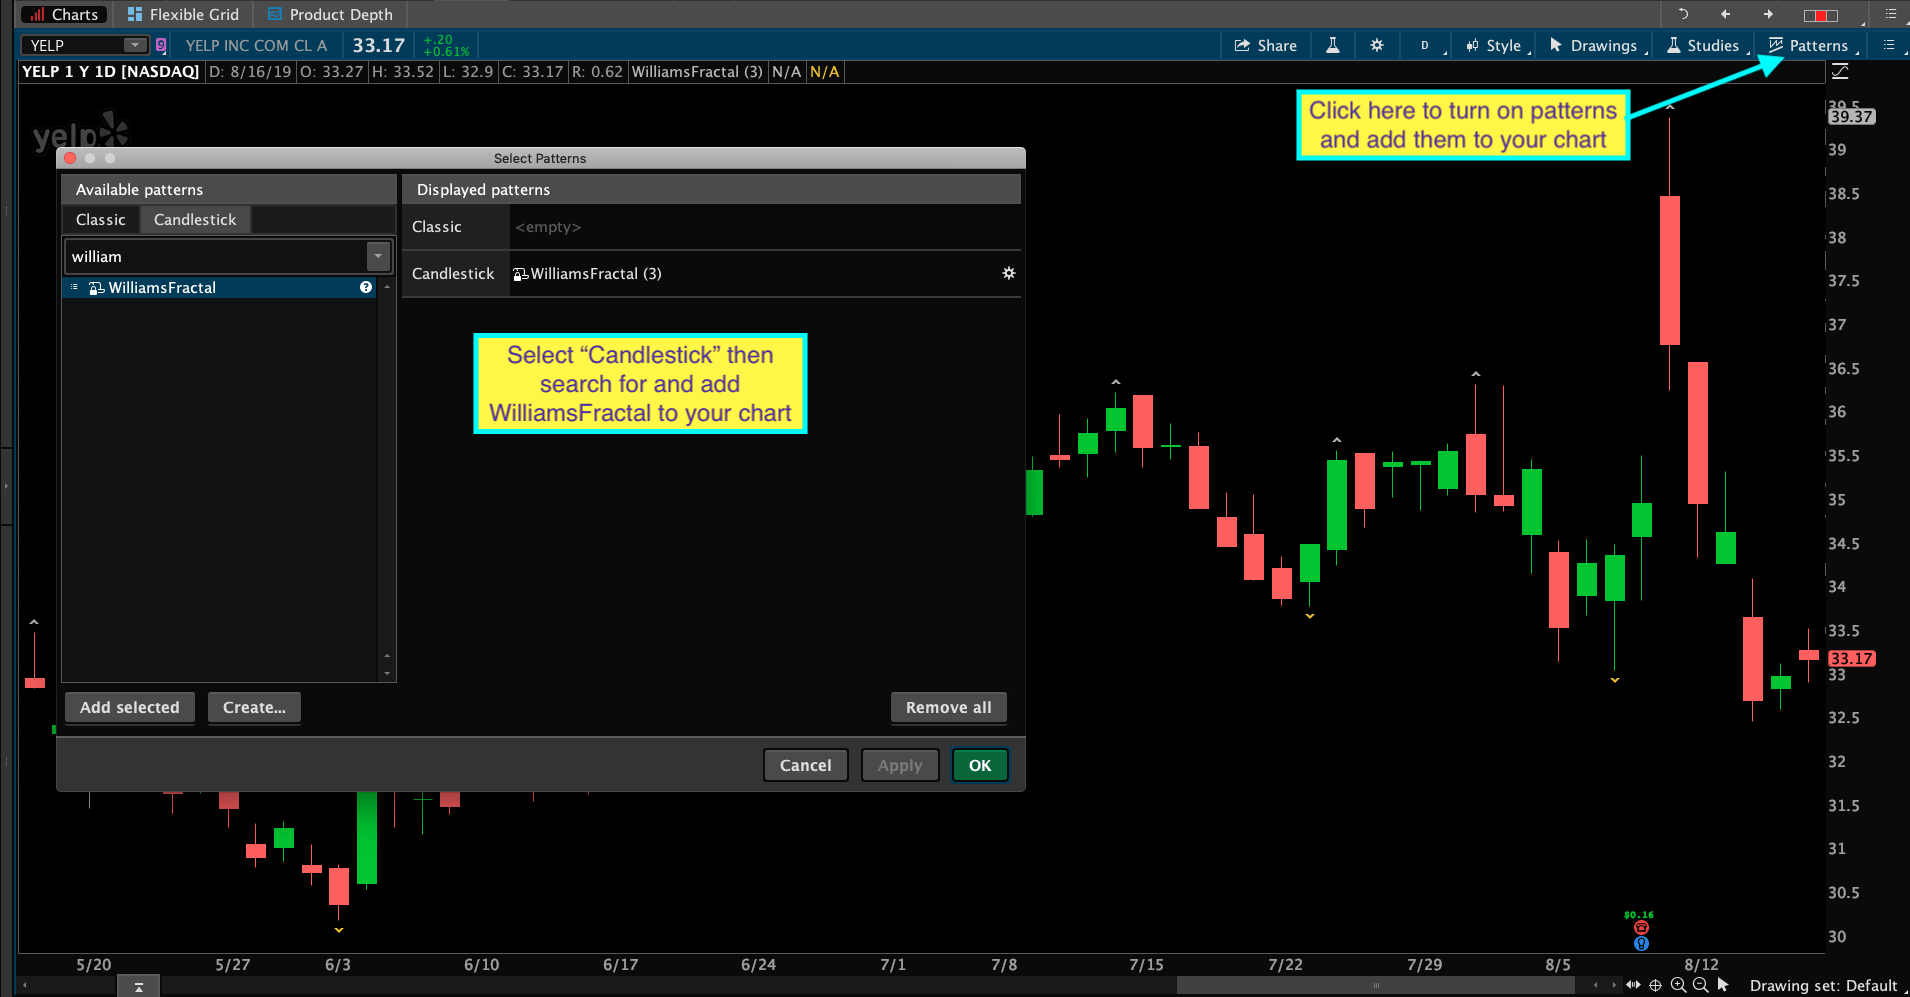
Your videos are great, I’ve learned a lot. I’ve read others requests for help and it looks like a lot of people have a deeper understanding than I do so this seems like a simple question/solution.

I want to plot pivot highs and lows on the TOS chart, seems simple enough, right…?

I’m defining a pivot high as a bar that has a high that’s higher than 3 bars in the past and the three bars in the future (to the right).

As you can see, by setting this up as Boolean point and close, then I can get the signal on the bar. what I wanted to happen was to have some kind of indicator, circle etc. be displayed above (pivot high) and below the bar (pivot low) where the conditions were all true. I know I have to use the “set painting” strategy but haven’t gotten it solved yet.

Also, the bars that are circled, are all bearish and the blue pivot high indicator is shown at the close of the bar, if someone didn’t know what they were looking at, they wouldn’t know that was a pivot high, can you explain why its displaying that way?

(I signed in using my wifes facebook page, linkedin would work correctly.)


Marked as spam
Posted by (Questions: 4, Answers: 7)
Asked on August 17, 2019 2:37 pm
854 views
0
I thought about this a little more, since a pivot high low is a support resistance point, I'd like the indicator to be a vertical line that maybe I can edit length, color/thickness...
( at August 17, 2019 3:53 pm)
0
Private answer

Without your code I cannot provide any solution here. I see that you tried to post a screenshot by adding a new solution to your question. However that is not permitted. That is reserved strictly for new solutions (answers that solve the question). If you would like to post this again be sure to include your code along with any screenshot you intended to show what you are talking about.

However, before doing so be sure to check out the WilliamsFractal pattern. Included with Thinkorswim. It already does what you have requested. (except for the horizontal lines)

Screenshot below shows how to add that to your chart.

Attachments:
Marked as spam
Posted by (Questions: 37, Answers: 4084)
Answered on August 17, 2019 5:20 pm
0
Pete, I understand from a few other posts I've been reading your recovering from an illness. I'm thrilled your on the mend, you add so much value to so many people. your solution above, friggin genius, thanks so much. if you figure out the horizontal lines that would be great but I can also draw them. thanks Pete, I really appreciate it.
( at August 17, 2019 5:44 pm)
0
oh by the way: Pivot high: high from -3 bars ago is less than high and high from -2 bars ago is less than high and high from -1 bars ago is less than high and high from 3 bars ago is less than high and high from 2 bars ago is less than high and high from 1 bars ago is less than high; Pivot Low: low from -3 bars ago is greater than low and low from -2 bars ago is greater than low and low from -1 bars ago is greater than low and low from 1 bars ago is greater than low and low from 2 bars ago is greater than low and low from 3 bars ago is greater than low. I learned how to do all of that from watching your videos. seriously helped me describe in patterns, crap that was in my head...
( at August 17, 2019 5:48 pm)