Chart with colored zones based on SPY prior day’s closing price


Category:
1
0

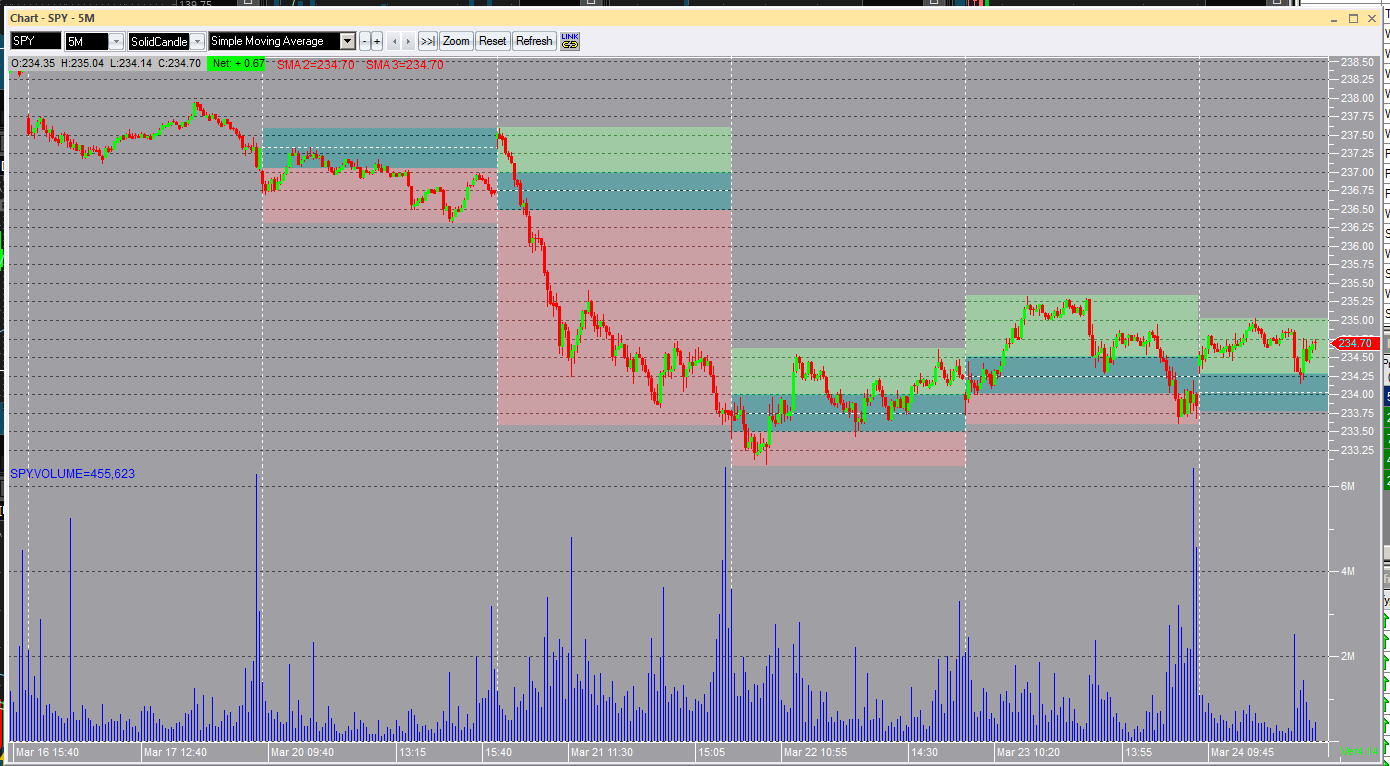
Hey traders,

is there a  way to set up on thinkorswim SPY chart

with colored zones based on SPY prior day’s closing price,

So basically the zone between -0.25 and +0.25 from the closing price of the previous day, would be a neutral zone and colored in blue.
Above this zone would be a bullish green area, And below this zone bearish area in red color

The idea would be for TOS to automatically recognize these areas and generate the colored regions for today

It would be interesting to use this feature to better map the trend of the day

like this image below


Attachments:
Marked as spam
Posted by (Questions: 7, Answers: 13)
Asked on March 30, 2017 9:52 am
149 views
0
Private answer

Yes, that would give a good overall indicator of wind direction
One of the ways you can do this would be to draw rectangles directly on the chart, and set the colors as desired
If you click the right button above the rectangle and click edit properties you can specify the limits of each rectangle in relation to the price of the ends and also in relation to the timeline

Trade safe !

Marked as spam
Posted by (Questions: 0, Answers: 3)
Answered on March 31, 2017 10:27 am