Code TOS Indicator with Another Indicator as Input


Category:
0
0

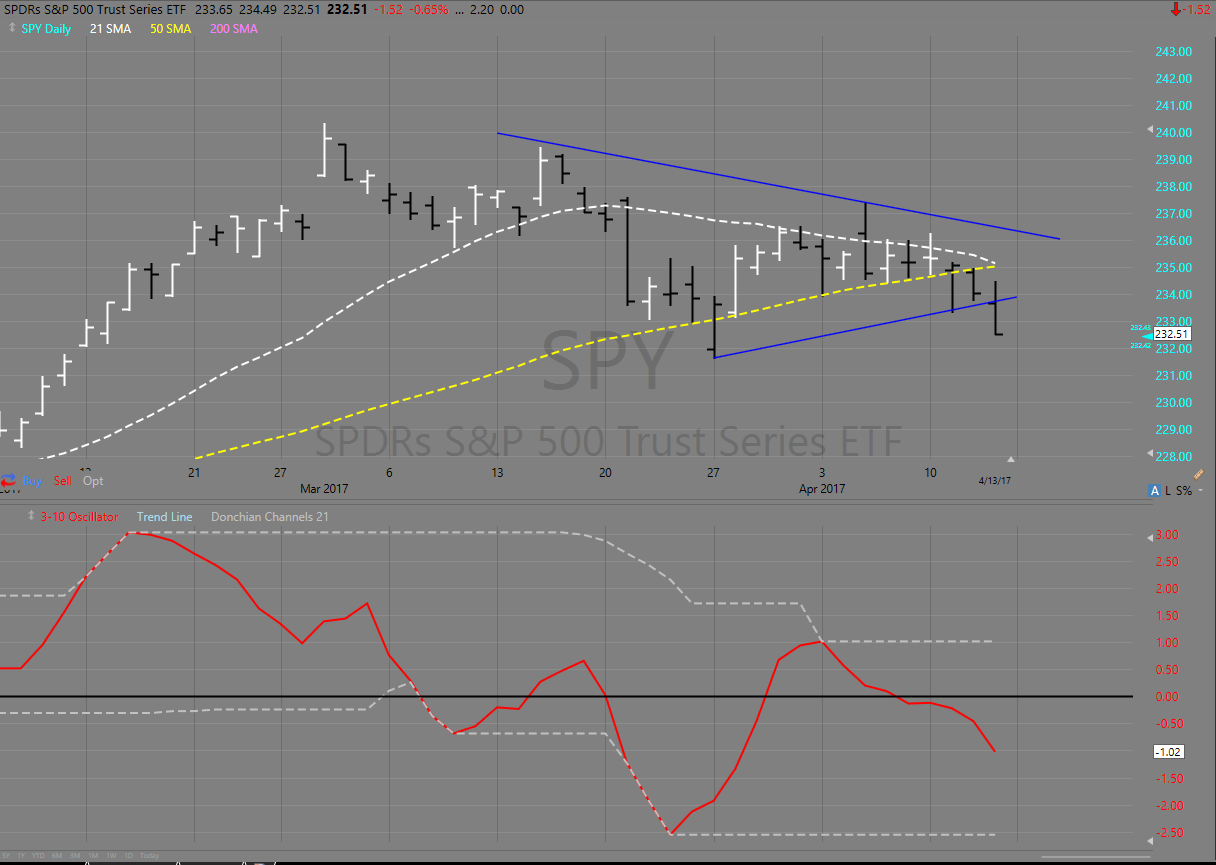
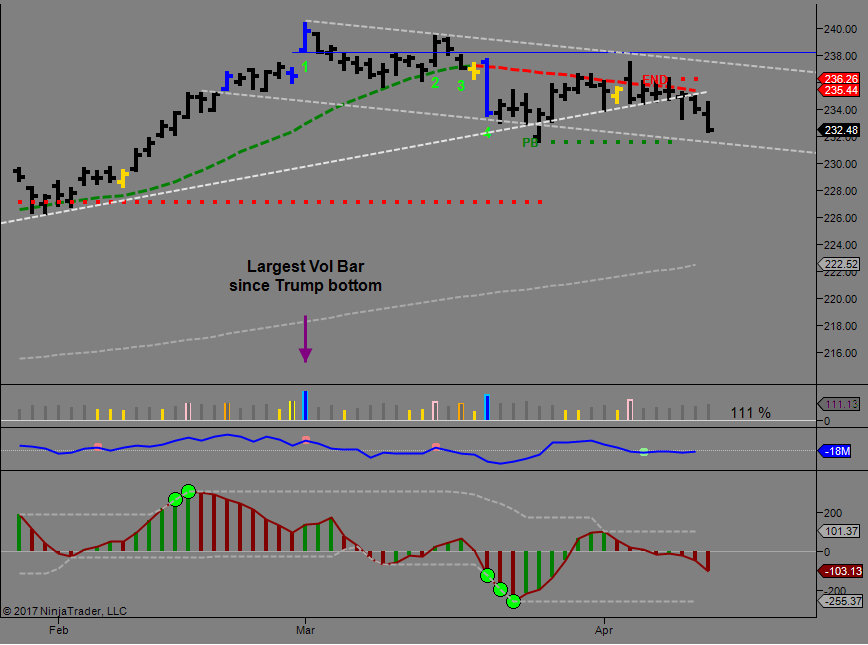
Hello,

Great tutorials and information. My question is as follow; Is it possible to code an indicator for Thinkorswim using another indicator as the input instead of price?

For example, I was trying to plot Donchian Channels but not of price, I wanted to plot the Donchian channels of the LBR 3-10 Oscillator available in Thinkorswim. This is possible to do in other platforms like Ninja Trader.

RESOLVED
Marked as spam
Posted by (Questions: 3, Answers: 5)
Asked on April 13, 2017 11:51 am
1179 views
1
Private answer

Ok, unfortunately I’m going to need to see some source code before i will attempt to do this. So long as this is open source. Or at lest show me the settings showing how the platform makes up for the missing price data. And we may end up taking this off the forum and charging a fee for the solution. Just depends how complicated this is to port over to Thinkorswim.

However, the solution may be just as simple as appending the following lines to the bottom of the LBR3-10 code that comes with Thinkorswim:

input length = 21;
plot trailingHigh = Highest(FastLine[1], length);
plot trailingLow = Lowest(FastLine[1], length);

Let us know if this works.

Marked as spam
Posted by (Questions: 37, Answers: 4084)
Answered on April 13, 2017 5:22 pm
0
Private answer

I have worked with some platforms that provide this functionality and you are correct that Thinkorswim is not one of them. So the only solution is to write our own custom Thinkscript using the output of the LBR3-10 as the inputs for the Donchian channel indicator.

However, we have a major hurdle to overcome before this is possible. And the hurdle is so large that I don’t think any of the platforms that support this functionality can handle it either. If they do, there is some major fudging going on behind the scenes.

Why? Ok so the LBR3-10 has 2 outputs. A slow line and a fast line. The Donchian Channel indicator requires 3 inputs, high, low, close. We are short one input. What are we to do? Having looked at the code. I personally feel these two are very poor match. I would be interested to hear others thoughts on the topic. Please post links if you have anything showing this being done in another platform.

Marked as spam
Posted by (Questions: 37, Answers: 4084)
Answered on April 13, 2017 2:59 pm
0
Private answer

Hello Pete,

The only plot that I am using from the LBR indicator is the fast line (3-10). I am not sure if that is going to make a difference in making this a reality for Thinkorswim. Aside from Ninja trader another platform that makes that possible is TC2000. I am including examples of both of them below.

Thanks for the fast response.

Attachments:
Marked as spam
Posted by (Questions: 3, Answers: 5)
Answered on April 13, 2017 4:10 pm
0
Private answer

Hi Pete

Thanks for the reply. I applied the above code to the bottom of the LBR indicator thinkscript as you suggested and it worked perfectly. See the below screenshot.

Thanks for your help.


Attachments:
Marked as spam
Posted by (Questions: 3, Answers: 5)
Answered on April 14, 2017 10:48 am